Specialty Real Estate
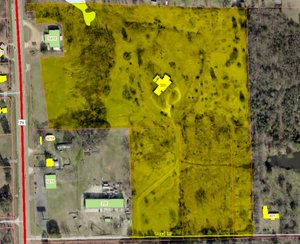
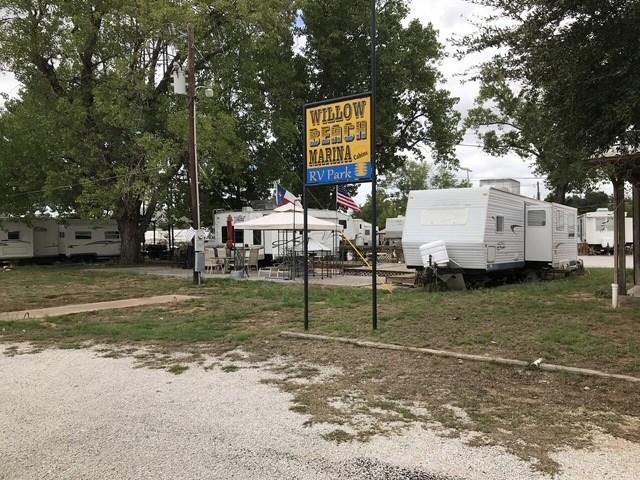
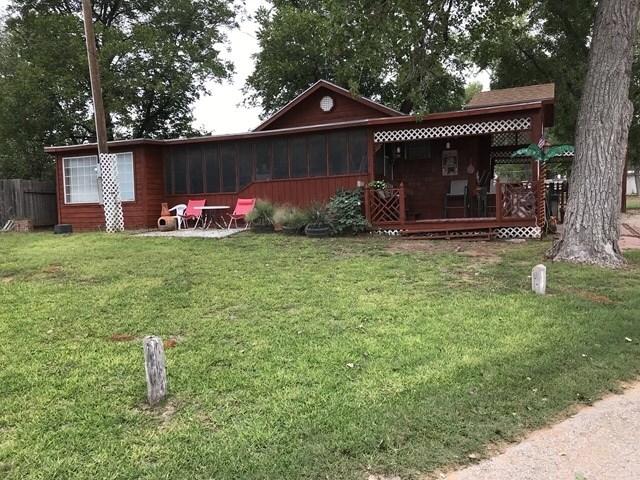
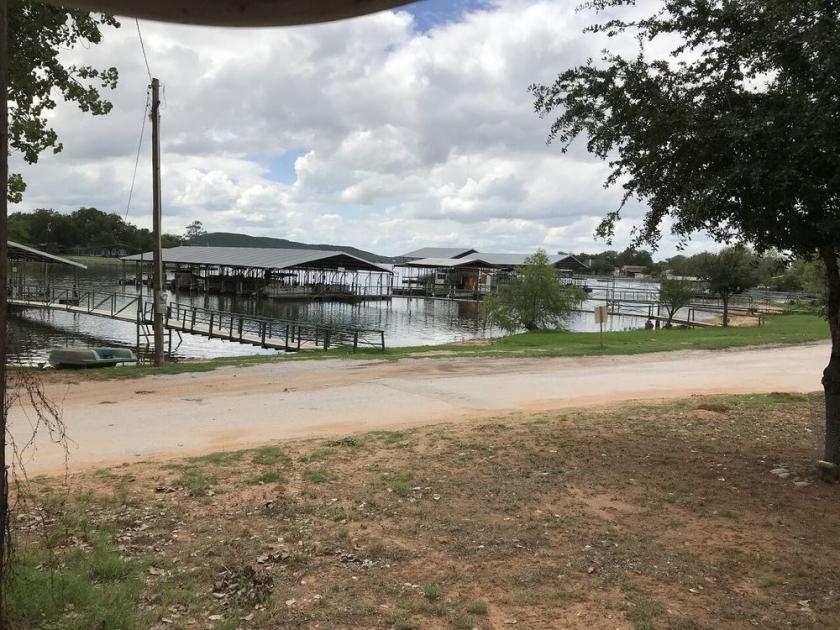
1239 Willow Beach Road Graford, TX 76449
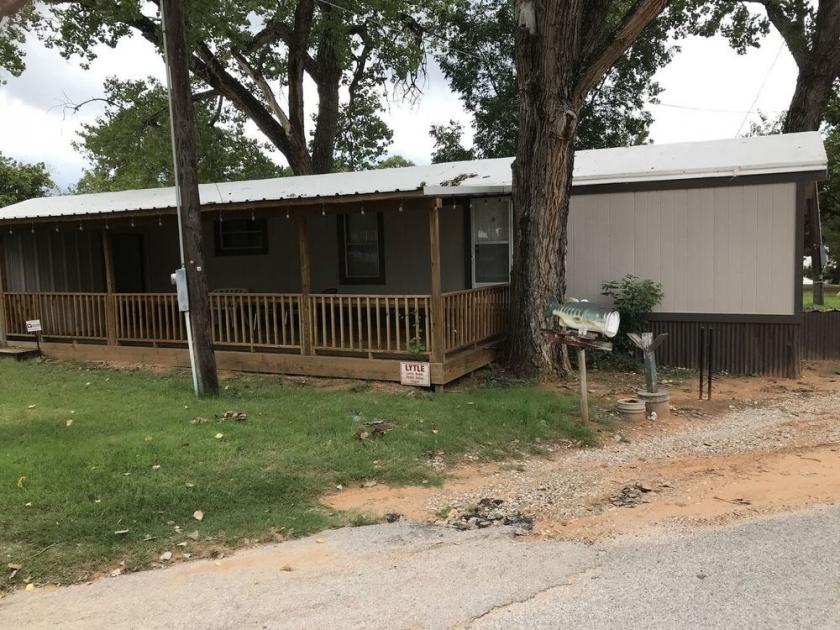
1239 Willow Beach Road Graford, TX 76449
Details & Description
Additional Photos

Listing Agents

Jerry Brewer
O: 903-793-2666
M: 903-691-0941
jerry@amreal.com
O: 903-793-2666
M: 903-691-0941
jerry@amreal.com
While we strive to provide the most accurate information, all listing information, and demographic data, is provided by third-parties. As such, MyEListing will not be responsible for the accuracy of the information. It is strongly recommended that you verify all information with the listing agent, and any relevant agencies, prior to making any decisions.