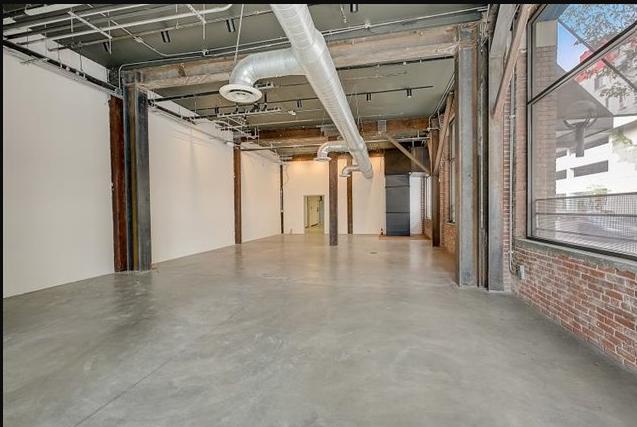
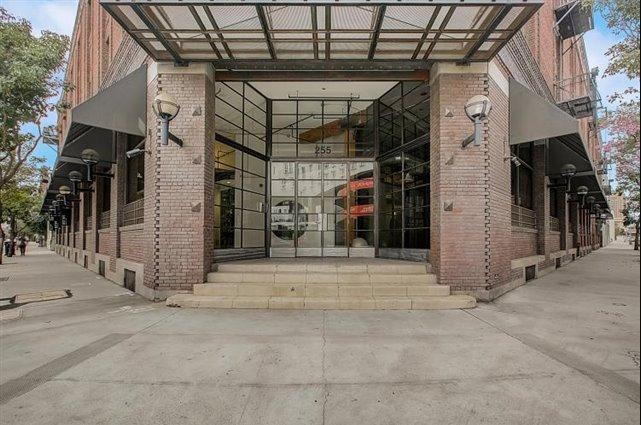
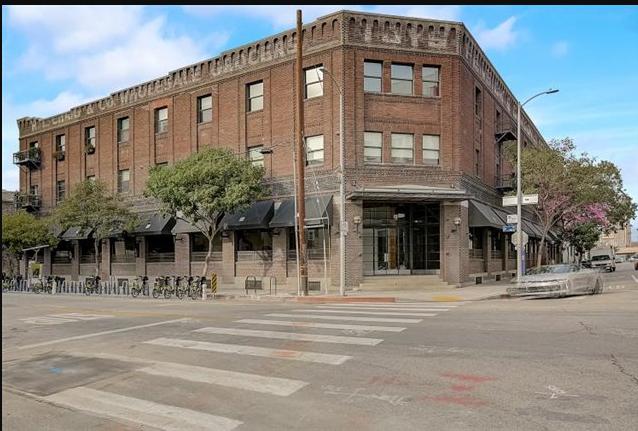
1-Mile | 3-Miles | 5-Miles | ||
---|---|---|---|---|
Total Population | 39,320 | 418,577 | 1,197,593 | |
Population Median Age | 40 | 35 | 35 | |
Population by Age | 0-9 Yrs | 1889 (4%) | 49530 (11%) | 149695 (12%) |
10-19 Yrs | 2200 (5%) | 53435 (12%) | 154616 (12%) | |
20-29 Yrs | 8802 (22%) | 82494 (19%) | 225800 (18%) | |
30-39 Yrs | 8498 (21%) | 71709 (17%) | 199152 (16%) | |
40-49 Yrs | 6158 (15%) | 56456 (13%) | 159822 (13%) | |
50-59 Yrs | 5074 (12%) | 43097 (10%) | 131202 (10%) | |
60-69 Yrs | 3562 (9%) | 31744 (7%) | 93964 (7%) | |
70+ Yrs | 3138 (7%) | 30113 (7%) | 83342 (6%) | |
Median HH Income | $28,190 | $40,863 | $44,675 | |
Total Household Income | < 24K | 7043 (47%) | 45195 (33%) | 109086 (28%) |
25-49K | 2242 (15%) | 33103 (24%) | 97103 (25%) | |
50-74K | 1255 (8%) | 20125 (14%) | 61727 (16%) | |
75-99K | 1104 (7%) | 12993 (9%) | 38685 (10%) | |
100-199K | 2521 (16%) | 19161 (14%) | 55572 (14%) | |
200K+ | 770 (5%) | 5325 (3%) | 15966 (4%) | |
Highest Education Level | No Diploma | 7985 | 112421 | 291475 |
Diploma or GED | 7266 | 54244 | 166690 | |
Some College | 5652 | 39162 | 115081 | |
Assoc. Degree | 1703 | 12730 | 37536 | |
Bachelors Degree | 6112 | 42155 | 128132 | |
Higher Degree | 2629 | 17803 | 50437 | |
Total Housing Units | 16,895 | 146,714 | 407,551 | |
--Owner-Occupied | 1,544 | 20,974 | 81,137 | |
--Renter-Occupied | 13,393 | 114,928 | 297,002 | |
Owner-Occupied Values | < 100K | 16 | 338 | 1459 |
100-199K | 6 | 414 | 1938 | |
200-299K | 122 | 1973 | 5957 | |
300-399K | 174 | 4252 | 13680 | |
400-499K | 311 | 4197 | 14806 | |
500K+ | 916 | 9800 | 43297 | |
Total Working Age Population | 36,215 | 336,564 | 958,748 | |
In Work Force | 15,194 | 211,776 | 623,032 | |
Not In Work Force | 21,022 | 124,787 | 335,716 | |
Workforce Employed | 13,813 | 196,233 | 576,962 | |
Workforce Unemployed | 1,381 | 15,487 | 45,900 | |
Civlian Workforce | 15,194 | 211,720 | 622,862 | |
Military Workforce | 0 | 56 | 170 | |
Total Households | 14,937 | 135,902 | 378,139 | |
Family Households | 4,060 | 75,531 | 231,023 | |
Non-Family Households | 10,877 | 60,371 | 147,116 | |
Married Couple | 2,570 | 41,207 | 130,801 | |
Other Family | 1,490 | 34,324 | 100,222 | |
Married w/Child | 819 | 17,937 | 57,994 | |
Single Male w/Child | 138 | 4,984 | 13,930 | |
Single Female w/Child | 613 | 11,632 | 32,352 |
Population Change Last Two Decades - Plus Projection
2000 | % | 2010 | % | 2020 | % | 2030 | |
---|---|---|---|---|---|---|---|
California | 33,871,648 | +10 | 37,253,956 | +9 | 40,467,295 | +8 | 43,631,295 |
Los Angeles County | 9,519,338 | +3 | 9,818,605 | +6 | 10,369,367 | +4 | 10,759,850 |
Total Working Age Population:
Total Households:
Total Working Age Population:
Total Households:
Total Working Age Population:
Total Households: