100% leased multi-tenant building leased to AquaSafe Swim School and Hertz
Absolute NNN ten year lease to be signed by Aqua- Safe Swim School at close of escrow
Hertz has just signed a fresh 5 year lease for 1,775 SF
No deferred maintenance
Strong financials with personal guarantee
AquaSafe is a locally owned and operated swim school with two locations that have been operating since 2003 in Scottsdale location and 2008 in Gilbert.
AquaSafe Swim School is a strong tenant that has survived the recession in 2008 and most recently the pandemic
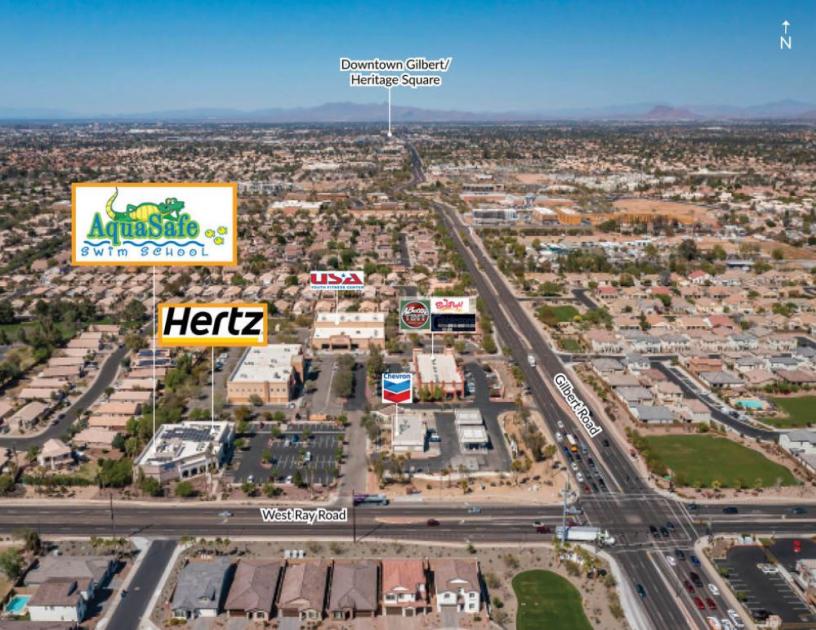
Located just 1.5 miles south of Downtown Gilbert/ Heritage SquareExcellent demographics with an average household income of $113,374 within 1 mile and more than 111,824 people within 5 miles.
No part of this information may be copied, reproduced, repurposed, or screen-captured for any commercial purpose without prior written authorization from MyEListing.
While we strive to provide the most accurate information, all listing information, and demographic data, is provided by third-parties. As such, MyEListing will not be responsible for the accuracy of the information. It is strongly recommended that you verify all information with the listing agent, and any relevant agencies, prior to making any decisions.
What is the asking price for 82 West Ray Road in Gilbert?
The asking price for 82 West Ray Road is $2,514,000
What is the building size of this Retail property in Gilbert, AZ?
The size of the building/unit at 82 West Ray Road in Gilbert is 10,880 square feet
How much land does the Gilbert, AZ property at 82 West Ray Road include?
82 West Ray Road in Gilbert includes 1.650 acres of land
What is the population within 1 mile of 82 West Ray Road in Gilbert?
The population within 1 mile of 82 West Ray Road Gilbert, AZ 85233 is 11,745 people.
Who do I contact for questions about 82 West Ray Road?
You should contact the listing agent,
Rommie Mojahed, for any details regarding this commercial listing.