Absolute NNN ten year lease to be signed by AquaSafe Swim School at close of escrow
No deferred maintenance
Strong financials with personal guarantee
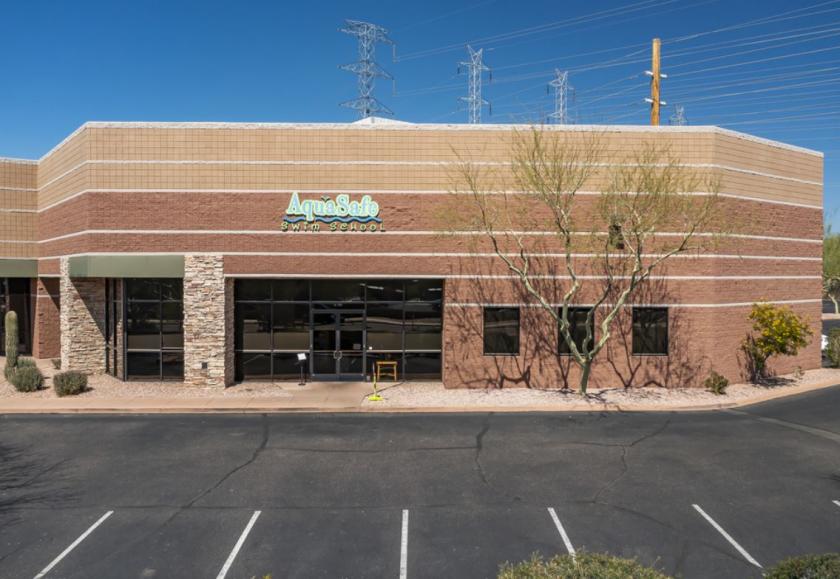
AquaSafe is a locally owned and operated swim school with two locations that have been operating since 2003 in Scottsdale location and 2008 in Gilbert.
AquaSafe Swim School is a strong tenant that has survived the recession in 2008 and most recently the pandemic
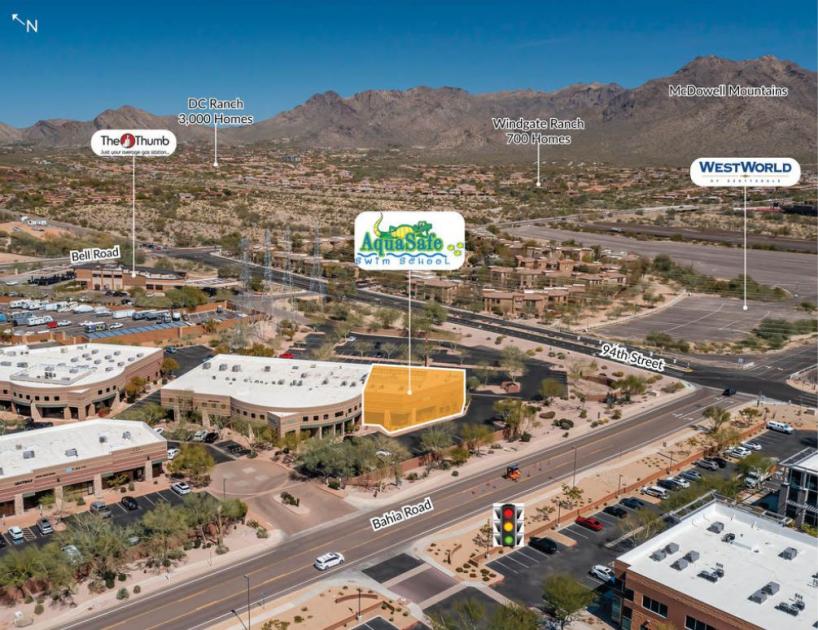
Located in the heart of North Scottsdale off Bell Road and the Loop 101, across the street from Westworld of Scottsdale
Westworld is a 386-acre multi-use events facility that is home to major events like Barrett-Jackson Classic Car Auction as well as conventions, trade shows, concerts, equestrian events and more and draws large crowds annually.
Excellent demographics with an average household income of $126,356 within 1 mile and more than 138,075 people within 5 miles.
Within 3 miles there are more than 6,000 homes in well-established, high end communities like DC Ranch, Windgate Ranch and McDowell Mountain Ranch
No part of this information may be copied, reproduced, repurposed, or screen-captured for any commercial purpose without prior written authorization from MyEListing.
While we strive to provide the most accurate information, all listing information, and demographic data, is provided by third-parties. As such, MyEListing will not be responsible for the accuracy of the information. It is strongly recommended that you verify all information with the listing agent, and any relevant agencies, prior to making any decisions.
What is the asking price for 9830 East Bahia Drive in Scottsdale?
The asking price for 9830 East Bahia Drive is $2,143,000
What is the building size of this Retail property in Scottsdale, AZ?
The size of the building/unit at 9830 East Bahia Drive in Scottsdale is 8,760 square feet
How much land does the Scottsdale, AZ property at 9830 East Bahia Drive include?
9830 East Bahia Drive in Scottsdale includes 0.208 acres of land
What kind of Retail is the propery at 9830 East Bahia Drive?
The property at 9830 East Bahia Drive Scottsdale, AZ 85260 is listed as a Shopping Center Retail property
What is the population within 1 mile of 9830 East Bahia Drive in Scottsdale?
The population within 1 mile of 9830 East Bahia Drive Scottsdale, AZ 85260 is 9,292 people.
Who do I contact for questions about 9830 East Bahia Drive?
You should contact the listing agent,
Rommie Mojahed, for any details regarding this commercial listing.