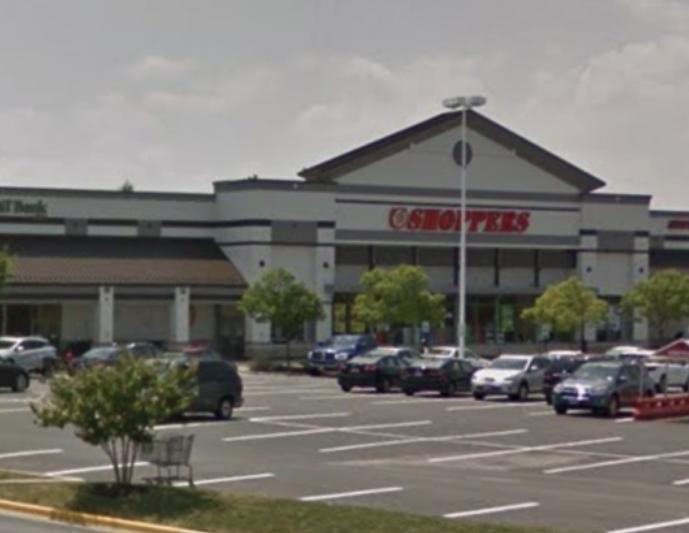
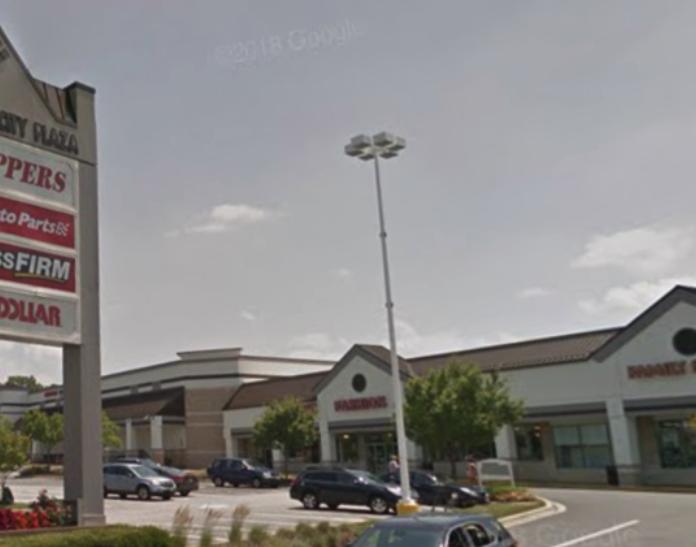
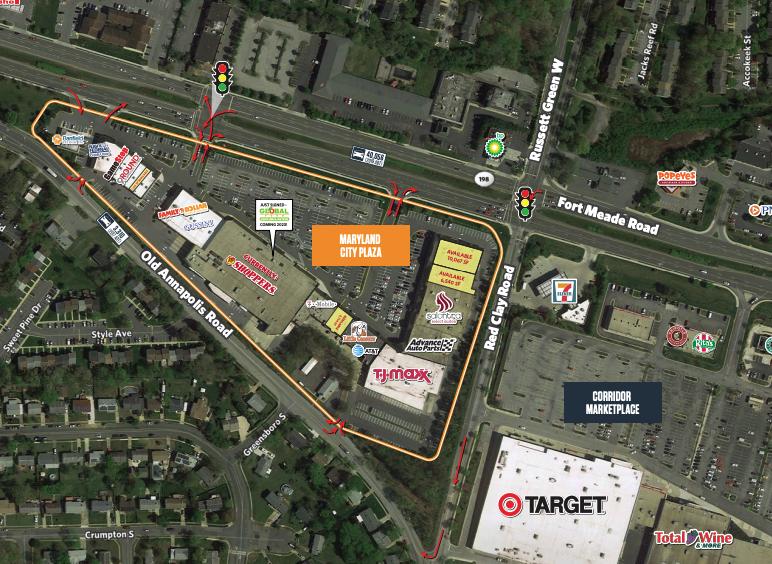
1-Mile | 3-Miles | 5-Miles | ||
---|---|---|---|---|
Total Population | 9,431 | 68,902 | 146,961 | |
Population Median Age | 35 | 34 | 35 | |
Population by Age | 0-9 Yrs | 1277 (13%) | 10735 (15%) | 20945 (14%) |
10-19 Yrs | 1139 (12%) | 7829 (11%) | 17341 (11%) | |
20-29 Yrs | 1587 (16%) | 11260 (16%) | 23491 (15%) | |
30-39 Yrs | 1489 (15%) | 12941 (18%) | 25886 (17%) | |
40-49 Yrs | 1156 (12%) | 9209 (13%) | 20247 (13%) | |
50-59 Yrs | 1577 (16%) | 8658 (12%) | 18867 (12%) | |
60-69 Yrs | 877 (9%) | 5004 (7%) | 11947 (8%) | |
70+ Yrs | 329 (3%) | 3266 (4%) | 8238 (5%) | |
Median HH Income | $97,669 | $84,819 | $92,596 | |
Total Household Income | < 24K | 226 (6%) | 2276 (9%) | 4290 (8%) |
25-49K | 418 (11%) | 4061 (16%) | 7230 (14%) | |
50-74K | 741 (19%) | 4150 (17%) | 8043 (16%) | |
75-99K | 535 (14%) | 3922 (16%) | 7880 (15%) | |
100-199K | 1655 (44%) | 7895 (32%) | 17150 (34%) | |
200K+ | 165 (4%) | 1752 (7%) | 5626 (11%) | |
Highest Education Level | No Diploma | 509 | 4895 | 8864 |
Diploma or GED | 1426 | 10200 | 20297 | |
Some College | 1110 | 8908 | 19149 | |
Assoc. Degree | 494 | 3181 | 6626 | |
Bachelors Degree | 1538 | 10684 | 24354 | |
Higher Degree | 1215 | 7783 | 19490 | |
Total Housing Units | 4,067 | 25,623 | 53,241 | |
--Owner-Occupied | 2,416 | 10,805 | 27,424 | |
--Renter-Occupied | 1,324 | 13,251 | 22,793 | |
Owner-Occupied Values | < 100K | 121 | 607 | 1207 |
100-199K | 72 | 841 | 2126 | |
200-299K | 1024 | 3239 | 7225 | |
300-399K | 1014 | 4098 | 9075 | |
400-499K | 160 | 1417 | 4524 | |
500K+ | 24 | 602 | 3266 | |
Total Working Age Population | 7,288 | 52,687 | 114,712 | |
In Work Force | 5,840 | 39,309 | 82,218 | |
Not In Work Force | 1,447 | 13,378 | 32,493 | |
Workforce Employed | 5,402 | 36,028 | 74,425 | |
Workforce Unemployed | 374 | 2,114 | 4,245 | |
Civlian Workforce | 5,775 | 38,142 | 78,670 | |
Military Workforce | 65 | 1,167 | 3,548 | |
Total Households | 3,740 | 24,057 | 50,218 | |
Family Households | 2,354 | 15,166 | 33,006 | |
Non-Family Households | 1,386 | 8,891 | 17,212 | |
Married Couple | 1,442 | 10,055 | 23,550 | |
Other Family | 912 | 5,111 | 9,456 | |
Married w/Child | 615 | 5,316 | 11,976 | |
Single Male w/Child | 84 | 618 | 1,106 | |
Single Female w/Child | 453 | 2,198 | 3,881 |
Population Change Last Two Decades - Plus Projection
2000 | % | 2010 | % | 2020 | % | 2030 | |
---|---|---|---|---|---|---|---|
Maryland | 5,296,486 | +9 | 5,773,552 | +6 | 6,141,900 | +6 | 6,518,750 |
Anne Arundel County | 489,656 | +10 | 537,656 | +7 | 573,250 | +4 | 596,700 |
Baltimore County | 754,292 | +7 | 805,029 | +5 | 847,000 | +2 | 862,200 |
Howard County | 247,842 | +16 | 287,085 | +17 | 336,900 | +9 | 366,800 |
Montgomery County | 873,341 | +11 | 971,777 | +8 | 1,052,050 | +7 | 1,128,800 |
Prince Georges County | 801,515 | +8 | 863,420 | +6 | 916,150 | +4 | 952,950 |
Total Working Age Population:
Total Households:
Total Working Age Population:
Total Households:
Total Working Age Population:
Total Households: