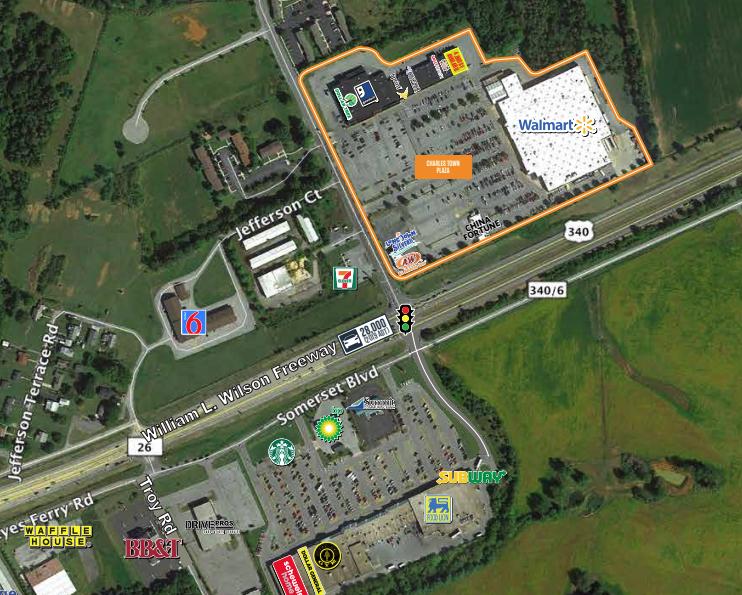
1-Mile | 3-Miles | 5-Miles | ||
---|---|---|---|---|
Total Population | 3,233 | 17,270 | 34,011 | |
Population Median Age | 37 | 39 | 39 | |
Population by Age | 0-9 Yrs | 420 (12%) | 2138 (12%) | 4176 (12%) |
10-19 Yrs | 478 (14%) | 2242 (12%) | 4419 (12%) | |
20-29 Yrs | 334 (10%) | 1994 (11%) | 3736 (10%) | |
30-39 Yrs | 447 (13%) | 2378 (13%) | 4392 (12%) | |
40-49 Yrs | 605 (18%) | 2811 (16%) | 5180 (15%) | |
50-59 Yrs | 445 (13%) | 2271 (13%) | 4946 (14%) | |
60-69 Yrs | 319 (9%) | 1789 (10%) | 3847 (11%) | |
70+ Yrs | 186 (5%) | 1647 (9%) | 3315 (9%) | |
Median HH Income | $76,071 | $71,723 | $79,722 | |
Total Household Income | < 24K | 190 (16%) | 1176 (18%) | 1933 (15%) |
25-49K | 234 (19%) | 1100 (16%) | 1953 (15%) | |
50-74K | 156 (13%) | 1098 (16%) | 2126 (16%) | |
75-99K | 143 (12%) | 823 (12%) | 1576 (12%) | |
100-199K | 352 (30%) | 1820 (28%) | 3836 (30%) | |
200K+ | 97 (8%) | 483 (7%) | 1196 (9%) | |
Highest Education Level | No Diploma | 209 | 1218 | 2356 |
Diploma or GED | 797 | 4162 | 7810 | |
Some College | 375 | 2553 | 5024 | |
Assoc. Degree | 104 | 693 | 1539 | |
Bachelors Degree | 526 | 2230 | 4321 | |
Higher Degree | 216 | 1251 | 2727 | |
Total Housing Units | 1,320 | 7,303 | 13,952 | |
--Owner-Occupied | 881 | 4,543 | 9,393 | |
--Renter-Occupied | 290 | 1,956 | 3,227 | |
Owner-Occupied Values | < 100K | 102 | 474 | 931 |
100-199K | 284 | 1437 | 2468 | |
200-299K | 279 | 1316 | 2817 | |
300-399K | 182 | 889 | 2085 | |
400-499K | 10 | 237 | 619 | |
500K+ | 24 | 190 | 473 | |
Total Working Age Population | 2,463 | 13,641 | 26,995 | |
In Work Force | 1,675 | 9,302 | 18,260 | |
Not In Work Force | 788 | 4,339 | 8,735 | |
Workforce Employed | 1,644 | 8,631 | 17,054 | |
Workforce Unemployed | 30 | 653 | 1,181 | |
Civlian Workforce | 1,674 | 9,283 | 18,235 | |
Military Workforce | 1 | 19 | 25 | |
Total Households | 1,171 | 6,499 | 12,621 | |
Family Households | 842 | 4,368 | 8,836 | |
Non-Family Households | 329 | 2,131 | 3,784 | |
Married Couple | 631 | 3,332 | 6,938 | |
Other Family | 211 | 1,036 | 1,899 | |
Married w/Child | 279 | 1,413 | 2,923 | |
Single Male w/Child | 37 | 141 | 243 | |
Single Female w/Child | 92 | 391 | 642 |
Population Change Last Two Decades - Plus Projection
2000 | % | 2010 | % | 2020 | % | 2030 | |
---|---|---|---|---|---|---|---|
Maryland | 5,296,486 | +9 | 5,773,552 | +6 | 6,141,900 | +6 | 6,518,750 |
Washington County | 131,923 | +12 | 147,430 | +6 | 156,800 | +12 | 175,400 |
Virginia | 7,078,515 | +13 | 8,001,024 | +8 | 8,655,021 | +8 | 9,331,666 |
Clarke County | 12,652 | +11 | 14,034 | +3 | 14,509 | +5 | 15,279 |
Loudoun County | 169,599 | +84 | 312,311 | +38 | 430,584 | +29 | 554,808 |
West Virginia | 1,808,344 | +2 | 1,852,994 | -1 | 1,828,079 | -1 | 1,806,816 |
Berkeley County | 75,905 | +37 | 104,169 | +14 | 118,838 | +10 | 130,787 |
Jefferson County | 42,190 | +27 | 53,498 | +8 | 58,009 | +6 | 61,456 |
Total Working Age Population:
Total Households:
Total Working Age Population:
Total Households:
Total Working Age Population:
Total Households: