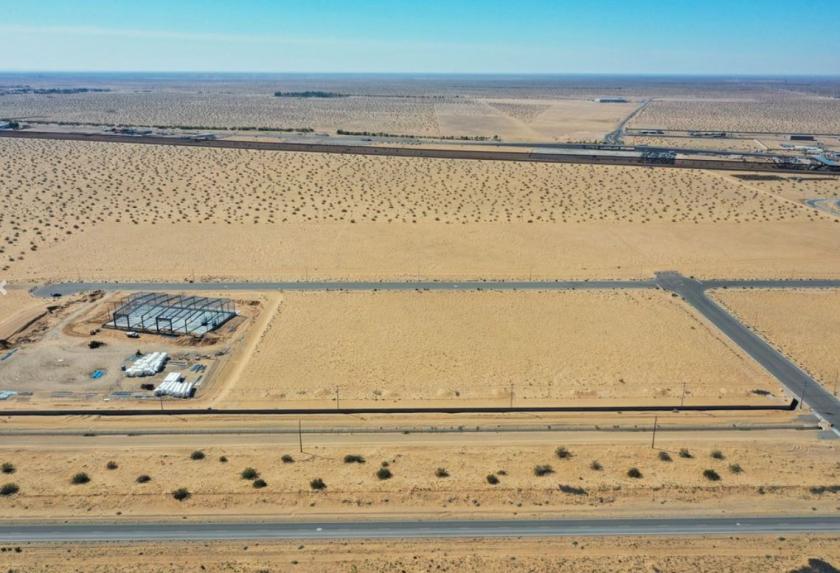
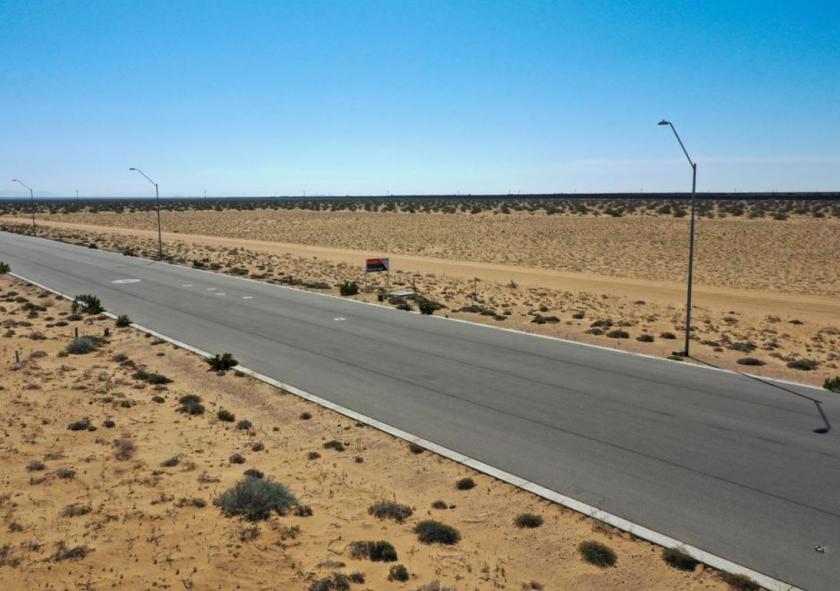
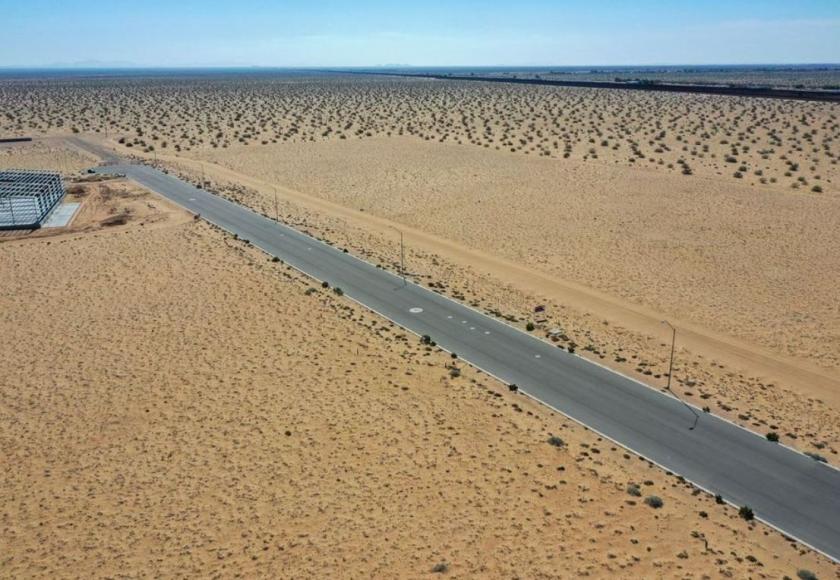
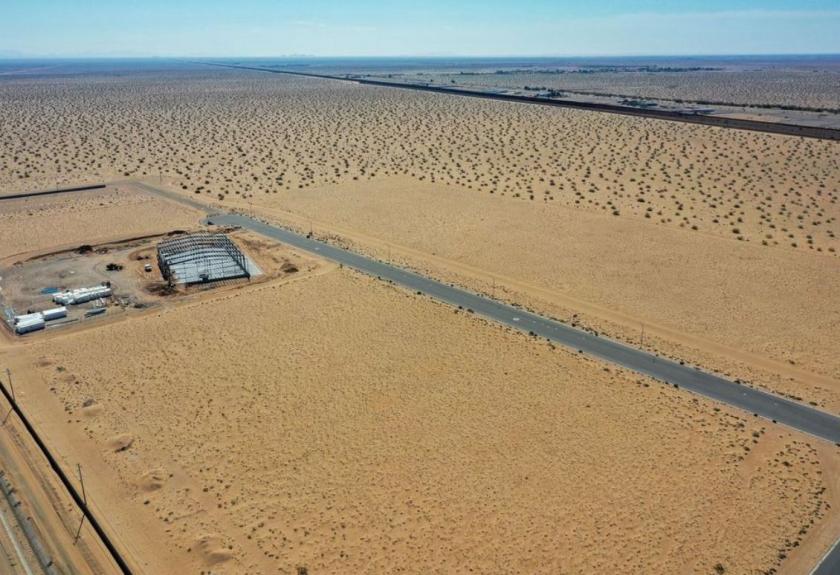
1-Mile | 3-Miles | 5-Miles | ||
---|---|---|---|---|
Total Population | 96 | 2,550 | 18,535 | |
Population Median Age | 36 | 29 | 31 | |
Population by Age | 0-9 Yrs | 2 (2%) | 413 (16%) | 2855 (15%) |
10-19 Yrs | 5 (5%) | 420 (16%) | 3382 (18%) | |
20-29 Yrs | 22 (22%) | 580 (22%) | 3189 (17%) | |
30-39 Yrs | 35 (36%) | 394 (15%) | 2764 (14%) | |
40-49 Yrs | 17 (17%) | 343 (13%) | 2604 (14%) | |
50-59 Yrs | 10 (10%) | 243 (9%) | 1937 (10%) | |
60-69 Yrs | 3 (3%) | 107 (4%) | 1141 (6%) | |
70+ Yrs | 2 (2%) | 51 (2%) | 662 (3%) | |
Median HH Income | $60,535 | $33,444 | $42,371 | |
Total Household Income | < 24K | 0 (0%) | 186 (36%) | 990 (22%) |
25-49K | 2 (40%) | 119 (23%) | 1617 (36%) | |
50-74K | 1 (20%) | 106 (20%) | 946 (21%) | |
75-99K | 0 (0%) | 53 (10%) | 484 (10%) | |
100-199K | 1 (20%) | 48 (9%) | 400 (8%) | |
200K+ | 0 (0%) | 0 (0%) | 30 (0%) | |
Highest Education Level | No Diploma | 24 | 669 | 5068 |
Diploma or GED | 25 | 282 | 1897 | |
Some College | 26 | 286 | 2067 | |
Assoc. Degree | 3 | 91 | 491 | |
Bachelors Degree | 3 | 84 | 781 | |
Higher Degree | 1 | 12 | 206 | |
Total Housing Units | 5 | 546 | 4,701 | |
--Owner-Occupied | 4 | 325 | 3,435 | |
--Renter-Occupied | 1 | 188 | 1,032 | |
Owner-Occupied Values | < 100K | 0 | 101 | 592 |
100-199K | 4 | 207 | 2527 | |
200-299K | 0 | 16 | 253 | |
300-399K | 0 | 0 | 45 | |
400-499K | 0 | 0 | 18 | |
500K+ | 0 | 0 | 0 | |
Total Working Age Population | 92 | 1,896 | 13,694 | |
In Work Force | 9 | 896 | 7,994 | |
Not In Work Force | 83 | 1,000 | 5,700 | |
Workforce Employed | 9 | 741 | 7,075 | |
Workforce Unemployed | 0 | 156 | 919 | |
Civlian Workforce | 9 | 896 | 7,994 | |
Military Workforce | 0 | 0 | 0 | |
Total Households | 5 | 513 | 4,467 | |
Family Households | 5 | 490 | 4,188 | |
Non-Family Households | 0 | 23 | 278 | |
Married Couple | 4 | 339 | 3,169 | |
Other Family | 1 | 151 | 1,019 | |
Married w/Child | 2 | 224 | 1,739 | |
Single Male w/Child | 0 | 31 | 86 | |
Single Female w/Child | 0 | 68 | 465 |
Population Change Last Two Decades - Plus Projection
2000 | % | 2010 | % | 2020 | % | 2030 | |
---|---|---|---|---|---|---|---|
Arizona | 5,130,632 | +25 | 6,392,017 | +14 | 7,286,100 | +14 | 8,284,900 |
Yuma County | 160,026 | +22 | 195,751 | +18 | 231,800 | +14 | 263,800 |
Total Working Age Population:
Total Households:
Total Working Age Population:
Total Households:
Total Working Age Population:
Total Households: