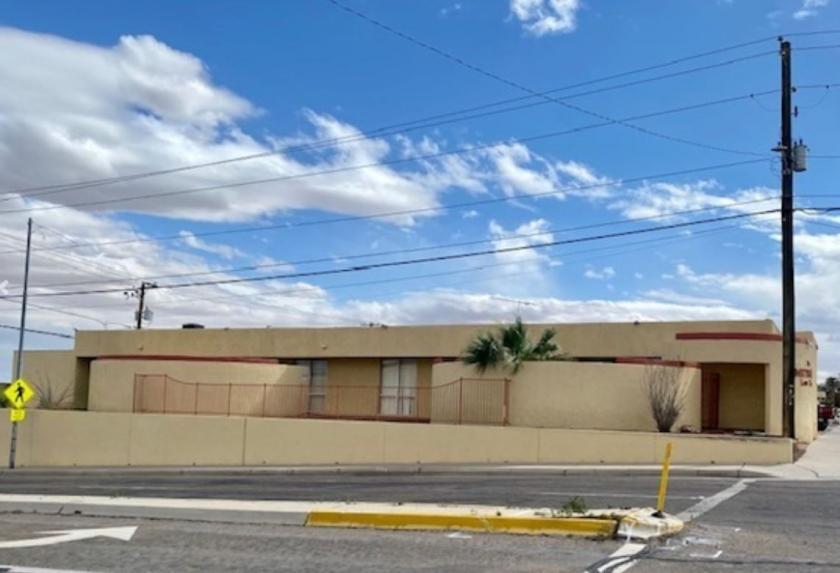
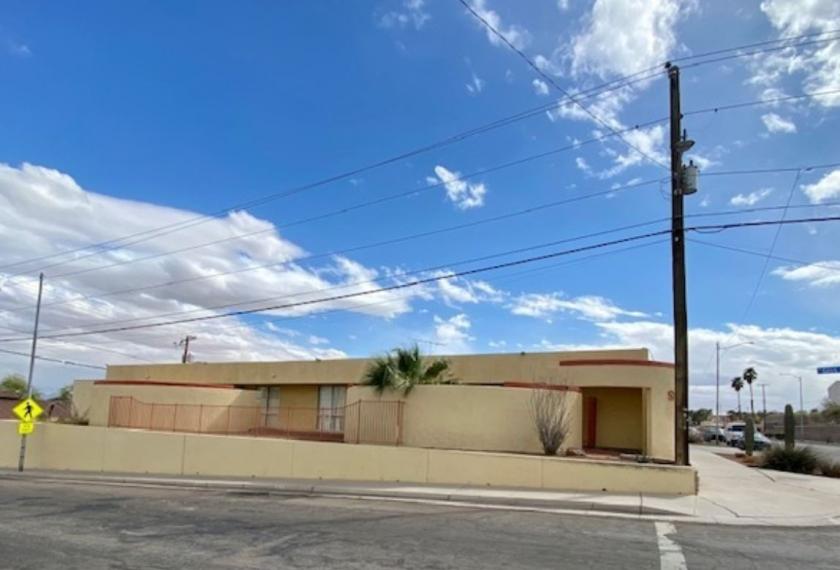
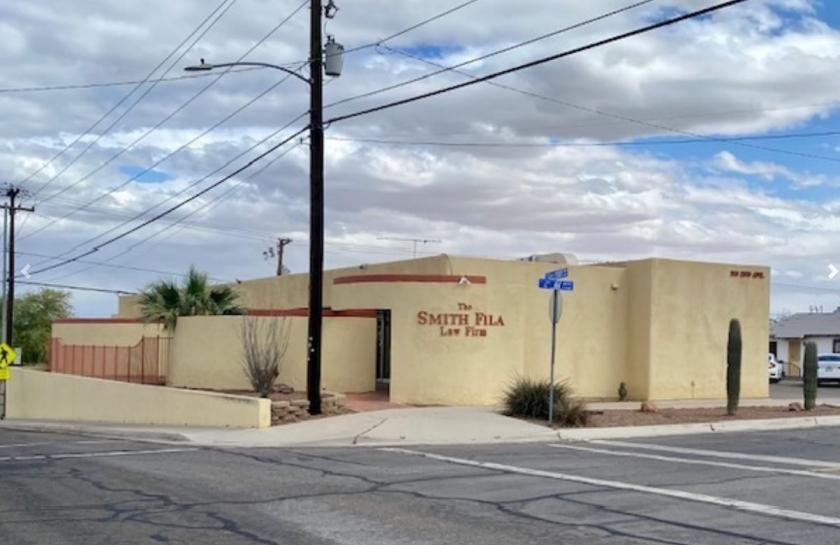
1-Mile | 3-Miles | 5-Miles | ||
---|---|---|---|---|
Total Population | 7,916 | 54,107 | 88,181 | |
Population Median Age | 34 | 36 | 36 | |
Population by Age | 0-9 Yrs | 986 (12%) | 8161 (15%) | 13074 (14%) |
10-19 Yrs | 1454 (18%) | 7559 (13%) | 12738 (14%) | |
20-29 Yrs | 1565 (19%) | 9775 (18%) | 15008 (17%) | |
30-39 Yrs | 873 (11%) | 6520 (12%) | 10898 (12%) | |
40-49 Yrs | 896 (11%) | 5098 (9%) | 9730 (11%) | |
50-59 Yrs | 945 (11%) | 5845 (10%) | 8925 (10%) | |
60-69 Yrs | 589 (7%) | 5011 (9%) | 8041 (9%) | |
70+ Yrs | 607 (7%) | 6137 (11%) | 9767 (11%) | |
Median HH Income | $29,166 | $36,580 | $42,289 | |
Total Household Income | < 24K | 1245 (45%) | 6844 (34%) | 9374 (29%) |
25-49K | 682 (25%) | 5949 (29%) | 9006 (28%) | |
50-74K | 347 (12%) | 3225 (16%) | 5267 (16%) | |
75-99K | 193 (7%) | 1857 (9%) | 3568 (11%) | |
100-199K | 233 (8%) | 1859 (9%) | 3967 (12%) | |
200K+ | 9 (0%) | 268 (1%) | 635 (1%) | |
Highest Education Level | No Diploma | 1858 | 9586 | 14063 |
Diploma or GED | 1207 | 9220 | 14229 | |
Some College | 916 | 7919 | 13251 | |
Assoc. Degree | 234 | 2755 | 4855 | |
Bachelors Degree | 315 | 2480 | 5136 | |
Higher Degree | 194 | 1758 | 3347 | |
Total Housing Units | 3,295 | 24,498 | 38,454 | |
--Owner-Occupied | 1,107 | 10,260 | 18,044 | |
--Renter-Occupied | 1,601 | 9,742 | 13,773 | |
Owner-Occupied Values | < 100K | 414 | 4168 | 6200 |
100-199K | 650 | 4722 | 7726 | |
200-299K | 26 | 982 | 3018 | |
300-399K | 7 | 270 | 807 | |
400-499K | 7 | 45 | 78 | |
500K+ | 4 | 72 | 215 | |
Total Working Age Population | 6,044 | 41,187 | 67,146 | |
In Work Force | 3,497 | 23,858 | 39,890 | |
Not In Work Force | 2,547 | 17,328 | 27,256 | |
Workforce Employed | 3,012 | 20,697 | 34,400 | |
Workforce Unemployed | 451 | 2,644 | 4,023 | |
Civlian Workforce | 3,463 | 23,341 | 38,423 | |
Military Workforce | 34 | 517 | 1,467 | |
Total Households | 2,708 | 20,003 | 31,817 | |
Family Households | 1,736 | 13,451 | 22,390 | |
Non-Family Households | 972 | 6,551 | 9,427 | |
Married Couple | 902 | 8,052 | 14,294 | |
Other Family | 835 | 5,399 | 8,097 | |
Married w/Child | 388 | 3,378 | 6,216 | |
Single Male w/Child | 128 | 832 | 1,300 | |
Single Female w/Child | 370 | 2,392 | 3,424 |
Population Change Last Two Decades - Plus Projection
2000 | % | 2010 | % | 2020 | % | 2030 | |
---|---|---|---|---|---|---|---|
Arizona | 5,130,632 | +25 | 6,392,017 | +14 | 7,286,100 | +14 | 8,284,900 |
Yuma County | 160,026 | +22 | 195,751 | +18 | 231,800 | +14 | 263,800 |
California | 33,871,648 | +10 | 37,253,956 | +9 | 40,467,295 | +8 | 43,631,295 |
Imperial County | 142,361 | +23 | 174,528 | +11 | 193,458 | +11 | 215,196 |
Total Working Age Population:
Total Households:
Total Working Age Population:
Total Households:
Total Working Age Population:
Total Households: