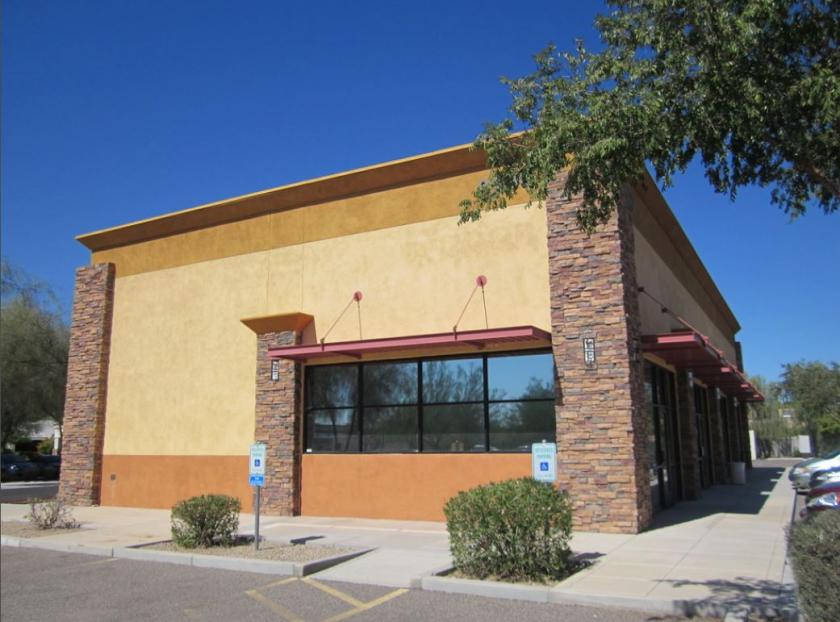
1-Mile | 3-Miles | 5-Miles | ||
---|---|---|---|---|
Total Population | 10,571 | 92,057 | 231,376 | |
Population Median Age | 55 | 48 | 45 | |
Population by Age | 0-9 Yrs | 746 (7%) | 8824 (9%) | 22735 (9%) |
10-19 Yrs | 462 (4%) | 8937 (9%) | 25600 (11%) | |
20-29 Yrs | 842 (7%) | 8045 (8%) | 24857 (10%) | |
30-39 Yrs | 748 (7%) | 8525 (9%) | 23810 (10%) | |
40-49 Yrs | 904 (8%) | 10031 (10%) | 25694 (11%) | |
50-59 Yrs | 1178 (11%) | 10722 (11%) | 29196 (12%) | |
60-69 Yrs | 1774 (16%) | 13825 (15%) | 32217 (13%) | |
70+ Yrs | 3917 (37%) | 23148 (25%) | 47268 (20%) | |
Median HH Income | $58,886 | $65,881 | $64,323 | |
Total Household Income | < 24K | 977 (18%) | 6133 (15%) | 15402 (16%) |
25-49K | 1167 (22%) | 8173 (20%) | 20468 (22%) | |
50-74K | 1172 (22%) | 7837 (20%) | 17080 (18%) | |
75-99K | 818 (15%) | 5711 (14%) | 13408 (14%) | |
100-199K | 971 (18%) | 9222 (23%) | 20984 (22%) | |
200K+ | 161 (3%) | 1926 (4%) | 5170 (5%) | |
Highest Education Level | No Diploma | 356 | 3845 | 13061 |
Diploma or GED | 2496 | 18384 | 45310 | |
Some College | 2173 | 17770 | 44240 | |
Assoc. Degree | 801 | 6957 | 16836 | |
Bachelors Degree | 2077 | 15688 | 33722 | |
Higher Degree | 1009 | 7986 | 18405 | |
Total Housing Units | 6,523 | 45,224 | 105,131 | |
--Owner-Occupied | 3,720 | 29,511 | 68,602 | |
--Renter-Occupied | 1,547 | 9,492 | 23,909 | |
Owner-Occupied Values | < 100K | 149 | 1699 | 6863 |
100-199K | 839 | 8082 | 19207 | |
200-299K | 1944 | 11010 | 21723 | |
300-399K | 617 | 5670 | 12006 | |
400-499K | 108 | 1874 | 4711 | |
500K+ | 63 | 1177 | 4092 | |
Total Working Age Population | 9,536 | 77,744 | 193,095 | |
In Work Force | 3,974 | 39,320 | 105,150 | |
Not In Work Force | 5,562 | 38,425 | 87,945 | |
Workforce Employed | 3,851 | 37,674 | 99,680 | |
Workforce Unemployed | 123 | 1,561 | 5,234 | |
Civlian Workforce | 3,974 | 39,235 | 104,914 | |
Military Workforce | 0 | 84 | 237 | |
Total Households | 5,267 | 39,003 | 92,511 | |
Family Households | 3,010 | 24,752 | 60,275 | |
Non-Family Households | 2,256 | 14,251 | 32,236 | |
Married Couple | 2,414 | 20,232 | 47,730 | |
Other Family | 597 | 4,520 | 12,545 | |
Married w/Child | 385 | 5,738 | 13,946 | |
Single Male w/Child | 58 | 844 | 2,101 | |
Single Female w/Child | 114 | 1,244 | 3,709 |
Population Change Last Two Decades - Plus Projection
2000 | % | 2010 | % | 2020 | % | 2030 | |
---|---|---|---|---|---|---|---|
Arizona | 5,130,632 | +25 | 6,392,017 | +14 | 7,286,100 | +14 | 8,284,900 |
Maricopa County | 3,072,149 | +24 | 3,817,117 | +16 | 4,436,900 | +15 | 5,107,700 |
Total Working Age Population:
Total Households:
Total Working Age Population:
Total Households:
Total Working Age Population:
Total Households: