Ever wanted to own your own Salon Suites? Now is your opportunity in the beautiful town of Cave Creek! Formerly operating Sherrie's Salon was a salon with hair stylists, masseuses, nail techs and artists. There are 12 suites/studios for hair stylists or nail techs and a suite with a shower for a masseuse. The monthly rental fees were previously $600 for hair stylists, and $500 for nail techs/masseuse.
The potential monthly gross revenue would be $7,500 with a normal mix indicated below:
10 hair stylists- $6,000
2 nail techs - $1,000
1 masseuse - $ 500
Total Revenue - $7,500
The salon monthly operating expenses used to average about $2,000 including cleaning supplies, if everyone helps cleanup the place or tasks are assigned on a rotating weekly basis, or if the owner helps keep the place clean.
Normal monthly bills below:
$ 1,100 Stage Coach Village POA fees
$ 450 APS electrical
$ 160 Repairs/Maintenance/Supplies
$ 150 Cave Creek Water/Sewer
$ 90 Cox internet
$ 50 Insurance (Liability)
Total Expenses $2,000
*Association covers building insurance, roof maintenance, landscaping, parking lot etc.
Net Annual Profit Potential $66,000 for owner operator
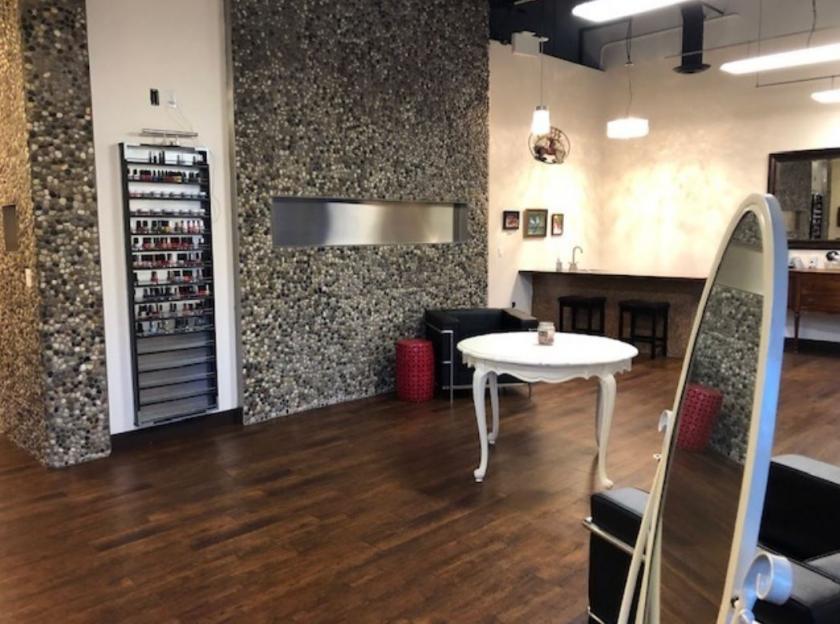
In addition to the suites the Salon has a large reception/lounge area with a coffee bar, a pedicure area, a hair drying lounge, an area for shampoo stations, two nice bathrooms, two storage rooms with lockers and a kitchenette with a washer and dryer. This truly is a ready-to-go salon suites, so come and open up your own business today!
NO TOURS WITHOUT PRIOR AUTHORIZATION FROM LISTING AGENTS