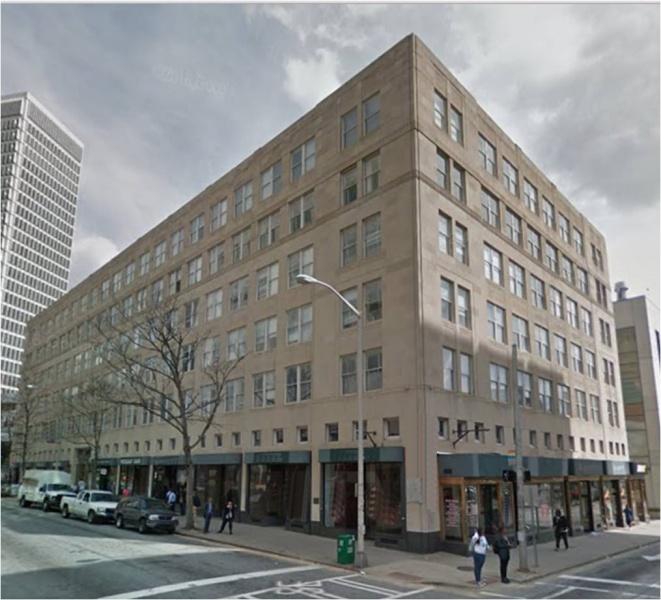
Size: 1,280 - 3,642 SF Street Level Retail Spaces for Lease
Lower Level Rate: $12.00/SF Net of Janitorial
Adjacent to GA State University
MARTA Rail & Street Car Access
Located in the Heart of the Opportunity Zone. For More information click here
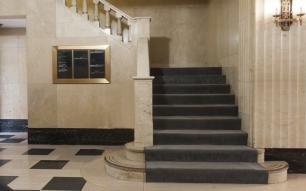
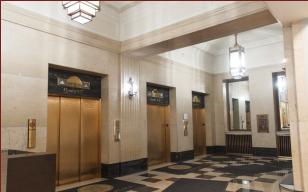
Building on National Register of Historic Places
Street Level Retail & Exposure
Below Market Rent Lower Level Space from 1,600 to 16,000 RSF
No part of this information may be copied, reproduced, repurposed, or screen-captured for any commercial purpose without prior written authorization from MyEListing.
While we strive to provide the most accurate information, all listing information, and demographic data, is provided by third-parties. As such, MyEListing will not be responsible for the accuracy of the information. It is strongly recommended that you verify all information with the listing agent, and any relevant agencies, prior to making any decisions.
What is the asking price for 10 Park Place Northeast in Atlanta?
The asking price for 10 Park Place Northeast is $12.00 a SF per Year
What is the building size of this commercial Retail property?
The size of this lease property at '.10 Park Place Northeast.' is 1600 square feet
What kind of Retail is the propery at 10 Park Place Northeast?
The property at 10 Park Place Northeast Atlanta, GA 30303 is listed as a Shopping Center Retail property
What is the population within 1 mile of 10 Park Place Northeast in Atlanta?
The population within 1 mile of 10 Park Place Northeast Atlanta, GA 30303 is 24,174 people.
Who do I contact for questions about 10 Park Place Northeast?
You should contact the listing agent,
Dave Smith, for any details regarding this commercial listing.