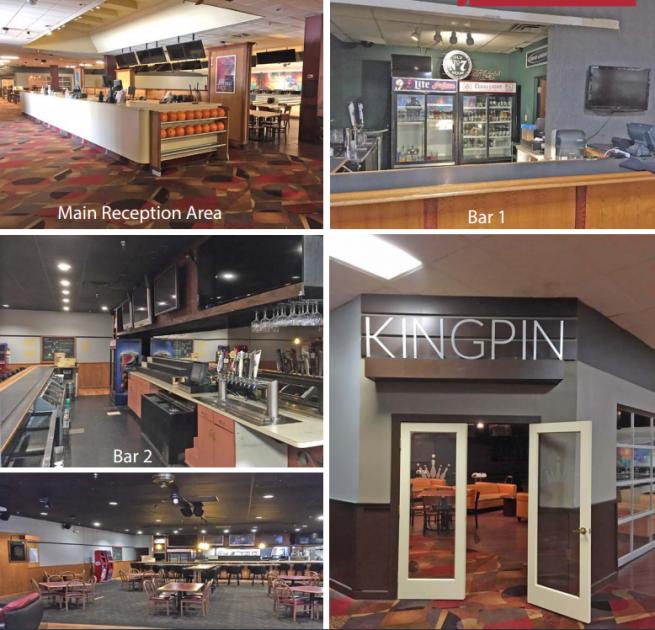
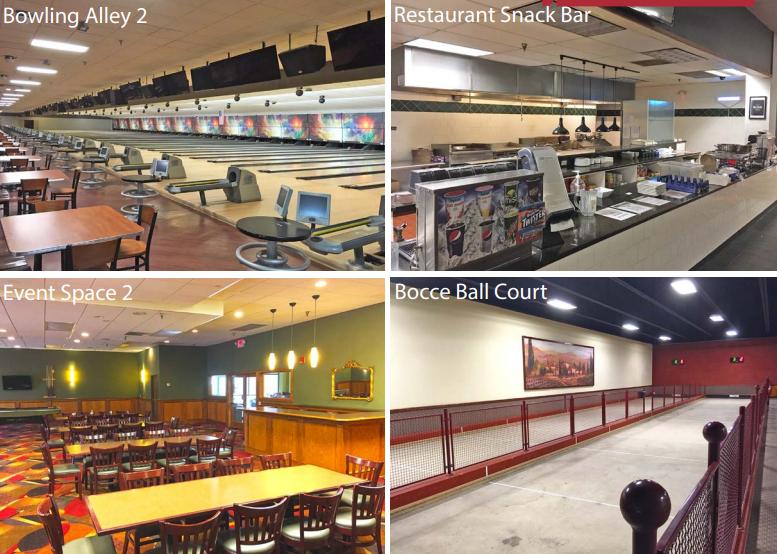
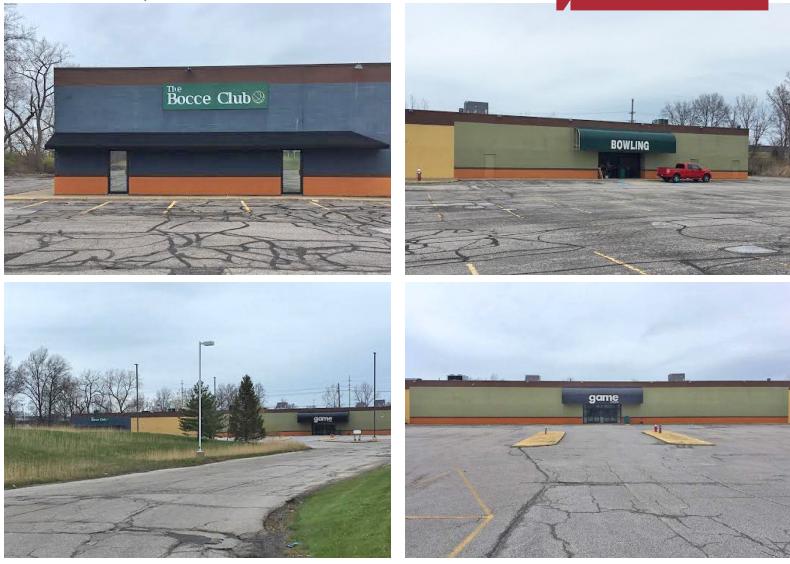
1-Mile | 3-Miles | 5-Miles | ||
---|---|---|---|---|
Total Population | 8,893 | 87,555 | 161,463 | |
Population Median Age | 39 | 41 | 42 | |
Population by Age | 0-9 Yrs | 1162 (13%) | 9410 (10%) | 16325 (10%) |
10-19 Yrs | 1218 (13%) | 9812 (11%) | 17381 (10%) | |
20-29 Yrs | 1144 (12%) | 13069 (14%) | 22246 (13%) | |
30-39 Yrs | 1015 (11%) | 10074 (11%) | 18125 (11%) | |
40-49 Yrs | 904 (10%) | 10342 (11%) | 17704 (10%) | |
50-59 Yrs | 1281 (14%) | 12806 (14%) | 25604 (15%) | |
60-69 Yrs | 1156 (12%) | 11284 (12%) | 22682 (14%) | |
70+ Yrs | 1013 (11%) | 10759 (12%) | 21396 (13%) | |
Median HH Income | $42,107 | $45,412 | $44,791 | |
Total Household Income | < 24K | 1248 (32%) | 11233 (27%) | 21894 (28%) |
25-49K | 967 (24%) | 11370 (27%) | 19867 (26%) | |
50-74K | 724 (18%) | 8023 (19%) | 13416 (17%) | |
75-99K | 438 (11%) | 5080 (12%) | 8919 (11%) | |
100-199K | 478 (12%) | 5040 (12%) | 10052 (13%) | |
200K+ | 28 (0%) | 789 (1%) | 2095 (2%) | |
Highest Education Level | No Diploma | 462 | 5248 | 10319 |
Diploma or GED | 2135 | 19749 | 36242 | |
Some College | 1595 | 16011 | 29414 | |
Assoc. Degree | 586 | 5904 | 10826 | |
Bachelors Degree | 740 | 9865 | 18562 | |
Higher Degree | 407 | 5345 | 11716 | |
Total Housing Units | 4,233 | 47,029 | 85,539 | |
--Owner-Occupied | 2,281 | 21,465 | 41,965 | |
--Renter-Occupied | 1,603 | 20,071 | 34,278 | |
Owner-Occupied Values | < 100K | 1099 | 8929 | 16119 |
100-199K | 1013 | 9646 | 18221 | |
200-299K | 129 | 1424 | 4193 | |
300-399K | 26 | 790 | 1813 | |
400-499K | 14 | 393 | 855 | |
500K+ | 0 | 282 | 763 | |
Total Working Age Population | 6,852 | 72,670 | 135,127 | |
In Work Force | 4,347 | 47,298 | 84,804 | |
Not In Work Force | 2,505 | 25,372 | 50,323 | |
Workforce Employed | 4,162 | 44,048 | 78,674 | |
Workforce Unemployed | 185 | 3,250 | 6,104 | |
Civlian Workforce | 4,347 | 47,298 | 84,778 | |
Military Workforce | 0 | 0 | 26 | |
Total Households | 3,884 | 41,536 | 76,243 | |
Family Households | 2,209 | 21,505 | 39,524 | |
Non-Family Households | 1,676 | 20,031 | 36,718 | |
Married Couple | 1,205 | 12,757 | 24,741 | |
Other Family | 1,004 | 8,747 | 14,783 | |
Married w/Child | 359 | 4,212 | 7,982 | |
Single Male w/Child | 56 | 640 | 1,363 | |
Single Female w/Child | 514 | 3,850 | 5,989 |
Population Change Last Two Decades - Plus Projection
2000 | % | 2010 | % | 2020 | % | 2030 | |
---|---|---|---|---|---|---|---|
Ohio | 11,353,140 | +2 | 11,536,504 | 0 | 11,574,870 | 0 | 11,615,100 |
Cuyahoga County | 1,393,978 | -8 | 1,280,122 | -6 | 1,209,550 | -5 | 1,154,210 |
Geauga County | 90,895 | +3 | 93,389 | 0 | 93,510 | +2 | 94,930 |
Lake County | 227,511 | +1 | 230,041 | -1 | 228,600 | 0 | 228,380 |
Total Working Age Population:
Total Households:
Total Working Age Population:
Total Households:
Total Working Age Population:
Total Households: