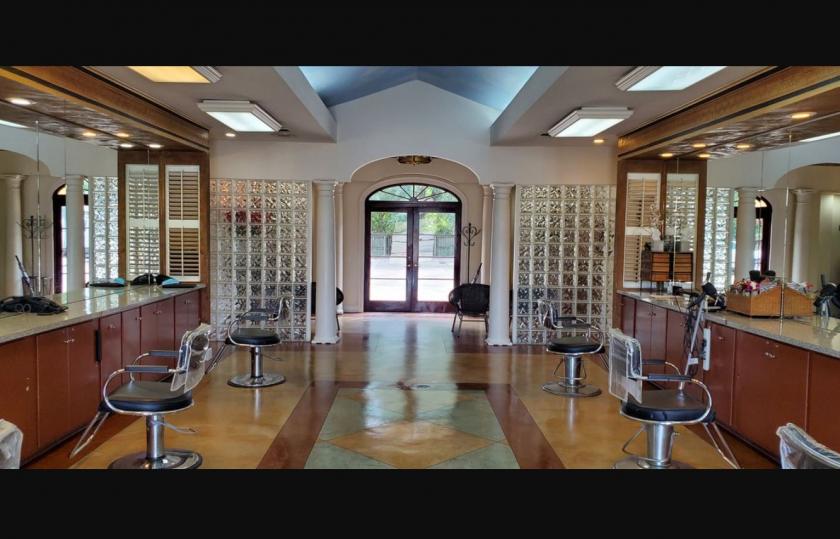
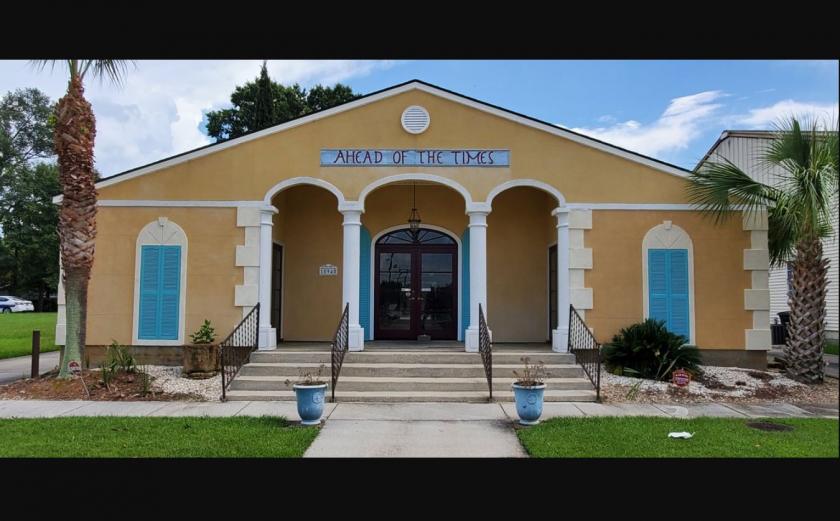
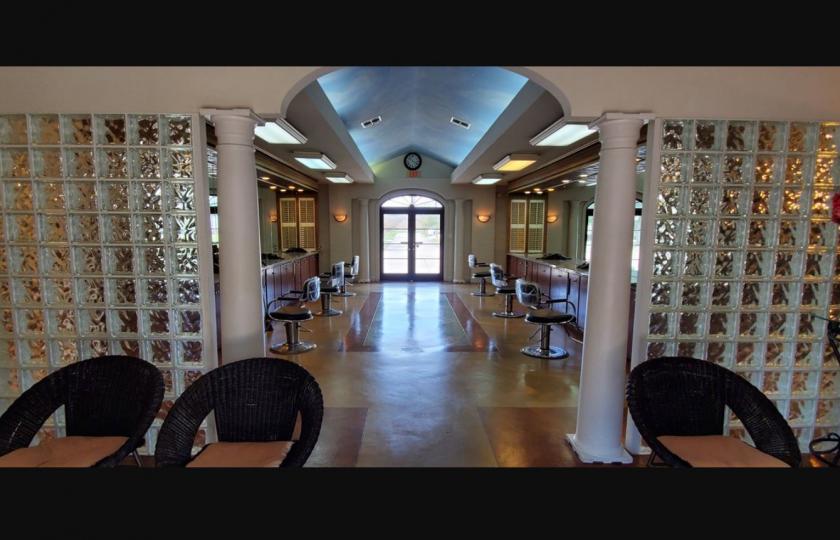
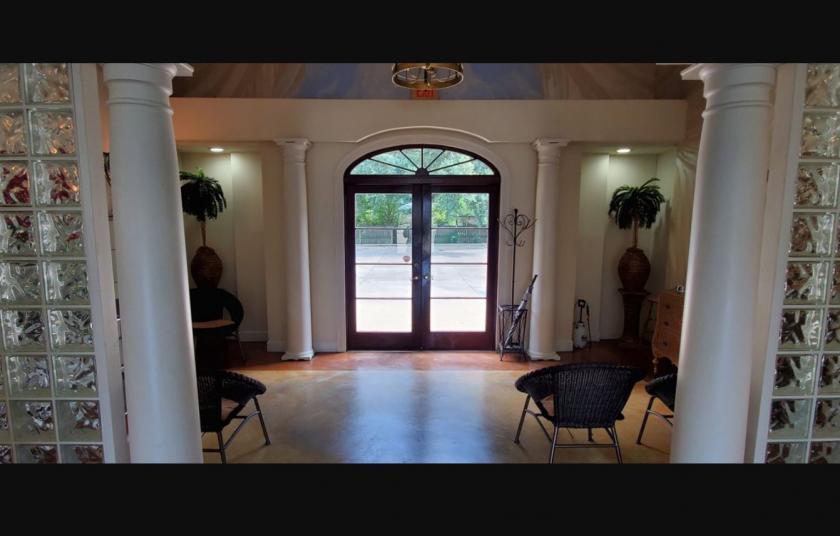
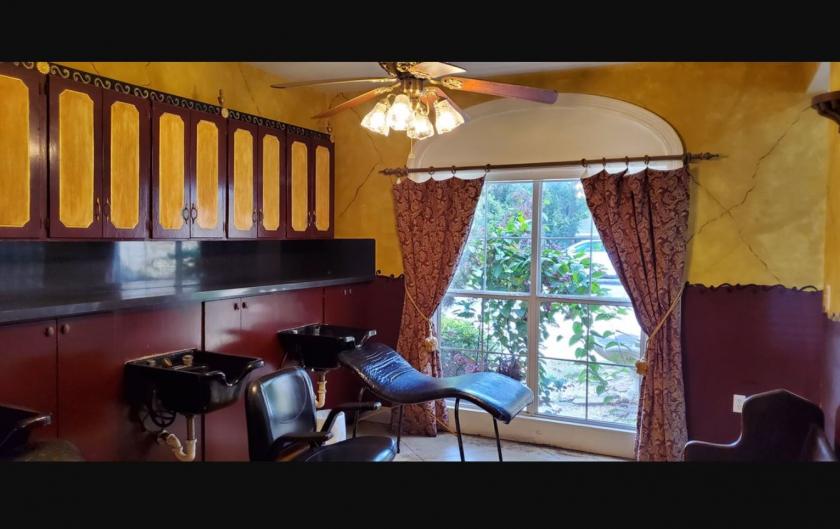
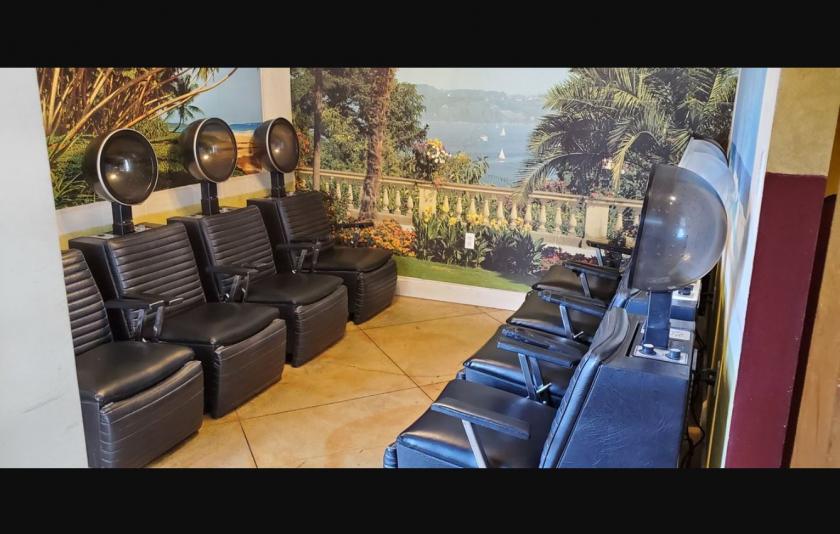
1-Mile | 3-Miles | 5-Miles | ||
---|---|---|---|---|
Total Population | 11,908 | 73,563 | 167,034 | |
Population Median Age | 36 | 37 | 37 | |
Population by Age | 0-9 Yrs | 2111 (17%) | 9984 (13%) | 22214 (13%) |
10-19 Yrs | 1501 (12%) | 8984 (12%) | 20453 (12%) | |
20-29 Yrs | 1697 (14%) | 12658 (17%) | 27213 (16%) | |
30-39 Yrs | 1573 (13%) | 10141 (13%) | 25501 (15%) | |
40-49 Yrs | 1242 (10%) | 8095 (11%) | 18226 (10%) | |
50-59 Yrs | 1576 (13%) | 8269 (11%) | 19176 (11%) | |
60-69 Yrs | 1222 (10%) | 7743 (10%) | 17761 (10%) | |
70+ Yrs | 988 (8%) | 7689 (10%) | 16490 (9%) | |
Median HH Income | $49,649 | $53,762 | $54,262 | |
Total Household Income | < 24K | 1110 (26%) | 5621 (20%) | 14451 (22%) |
25-49K | 1023 (24%) | 7277 (26%) | 15937 (24%) | |
50-74K | 932 (21%) | 5413 (19%) | 11085 (17%) | |
75-99K | 460 (10%) | 3349 (12%) | 7593 (11%) | |
100-199K | 633 (14%) | 5098 (18%) | 12734 (19%) | |
200K+ | 88 (2%) | 834 (3%) | 3248 (4%) | |
Highest Education Level | No Diploma | 775 | 3951 | 9812 |
Diploma or GED | 2678 | 14725 | 31148 | |
Some College | 1799 | 12204 | 27300 | |
Assoc. Degree | 374 | 2942 | 6161 | |
Bachelors Degree | 1256 | 9944 | 23872 | |
Higher Degree | 539 | 4456 | 12666 | |
Total Housing Units | 5,014 | 32,331 | 75,719 | |
--Owner-Occupied | 2,590 | 17,132 | 36,916 | |
--Renter-Occupied | 1,657 | 10,461 | 28,131 | |
Owner-Occupied Values | < 100K | 547 | 1901 | 5109 |
100-199K | 1499 | 10117 | 17079 | |
200-299K | 481 | 3843 | 8983 | |
300-399K | 39 | 676 | 2966 | |
400-499K | 0 | 182 | 970 | |
500K+ | 23 | 412 | 1809 | |
Total Working Age Population | 8,852 | 58,482 | 132,752 | |
In Work Force | 6,121 | 38,986 | 89,400 | |
Not In Work Force | 2,731 | 19,497 | 43,352 | |
Workforce Employed | 5,713 | 36,984 | 84,433 | |
Workforce Unemployed | 408 | 1,972 | 4,866 | |
Civlian Workforce | 6,121 | 38,957 | 89,299 | |
Military Workforce | 0 | 29 | 101 | |
Total Households | 4,246 | 27,593 | 65,048 | |
Family Households | 2,326 | 16,354 | 37,395 | |
Non-Family Households | 1,921 | 11,239 | 27,652 | |
Married Couple | 1,296 | 9,882 | 23,284 | |
Other Family | 1,030 | 6,473 | 14,112 | |
Married w/Child | 532 | 3,414 | 8,341 | |
Single Male w/Child | 116 | 723 | 1,354 | |
Single Female w/Child | 443 | 2,467 | 5,649 |
Population Change Last Two Decades - Plus Projection
2000 | % | 2010 | % | 2020 | % | 2030 | |
---|---|---|---|---|---|---|---|
Louisiana | 4,468,976 | +1 | 4,533,372 | +1 | 4,588,310 | +5 | 4,813,420 |
East Baton Rouge Parish | 412,852 | +7 | 440,171 | -3 | 426,380 | -1 | 421,500 |
Iberville Parish | 33,320 | 0 | 33,387 | -17 | 27,830 | -11 | 24,640 |
Livingston Parish | 91,814 | +39 | 128,026 | +40 | 179,820 | +35 | 242,780 |
St. Martin Parish | 48,583 | +7 | 52,160 | +6 | 55,520 | +3 | 57,000 |
West Baton Rouge Parish | 21,601 | +10 | 23,788 | -7 | 22,220 | -5 | 21,070 |
Total Working Age Population:
Total Households:
Total Working Age Population:
Total Households:
Total Working Age Population:
Total Households: