Industrial Properties
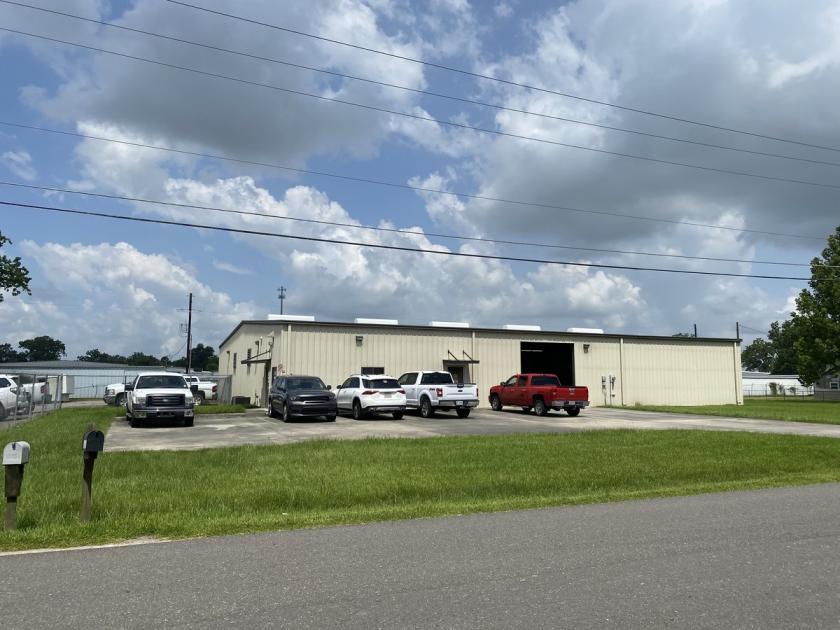
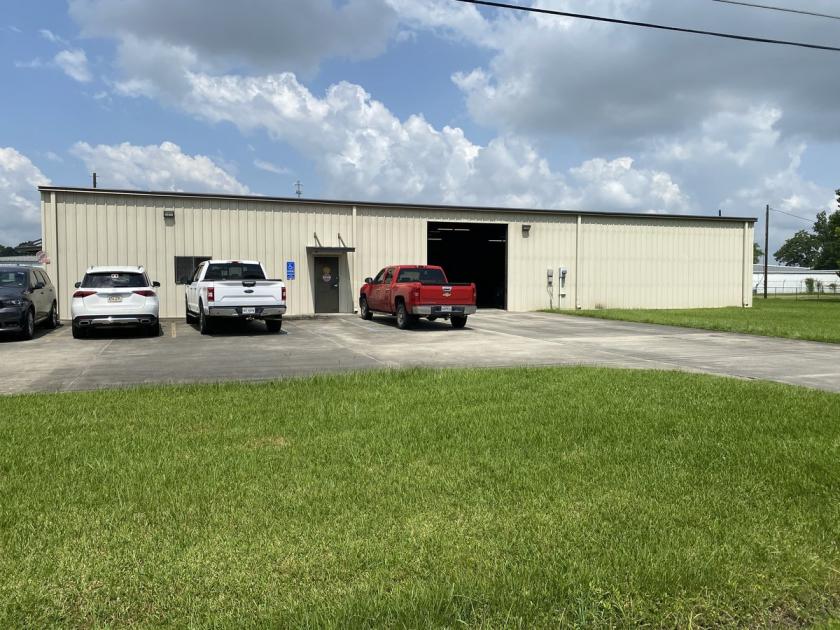
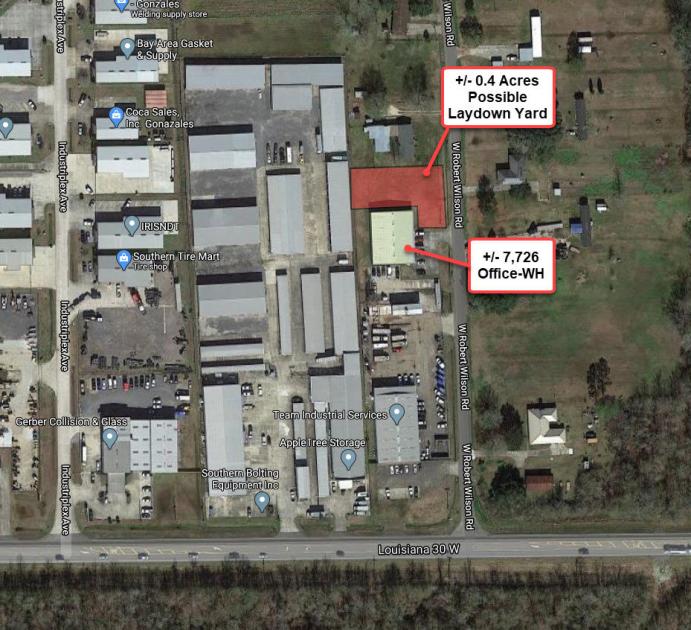
10059 West Robert Wilson Road Gonzales, LA 70737
10059 West Robert Wilson Road Gonzales, LA 70737
Details & Description
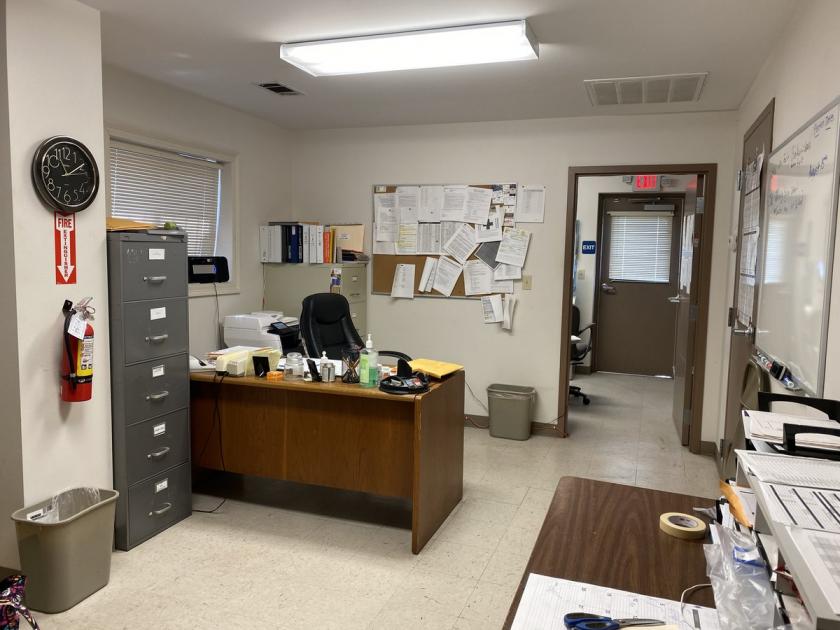
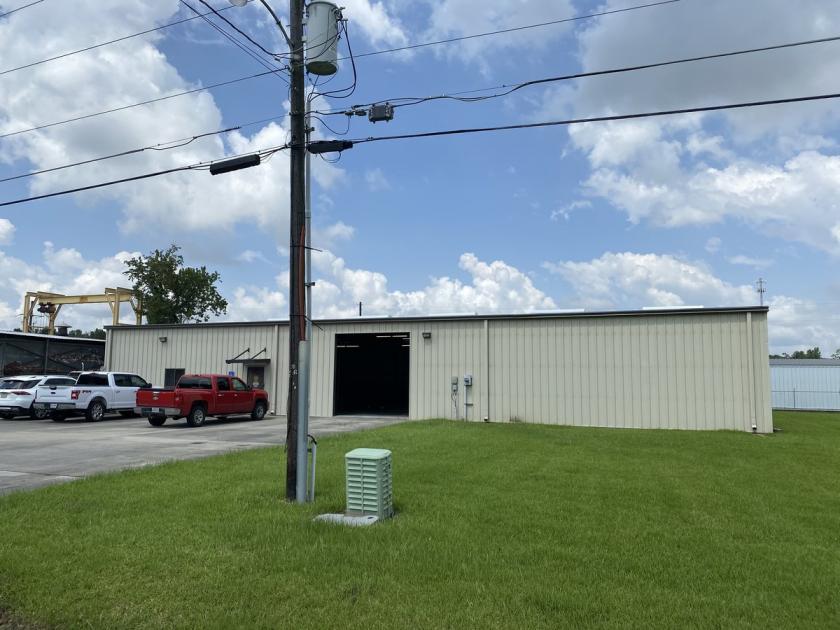
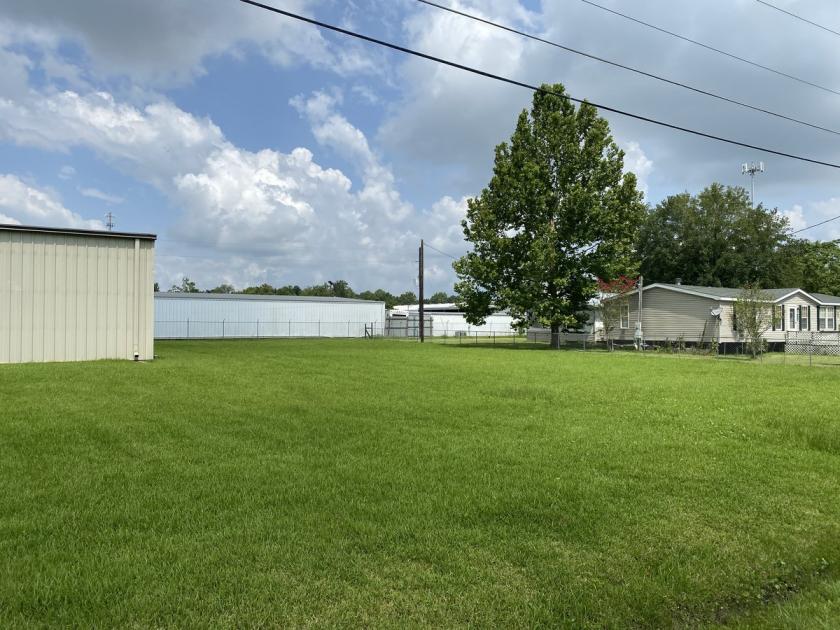
Additional Photos
Listing Agents

Walt Ketchings
O: 225-295-0800
M: 225-241-3110
wketchings@latterblum.com
O: 225-295-0800
M: 225-241-3110
wketchings@latterblum.com

Erin Caballero
O: 225-295-0800
erinc@latterblum.com
O: 225-295-0800
erinc@latterblum.com
While we strive to provide the most accurate information, all listing information, and demographic data, is provided by third-parties. As such, MyEListing will not be responsible for the accuracy of the information. It is strongly recommended that you verify all information with the listing agent, and any relevant agencies, prior to making any decisions.