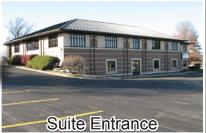
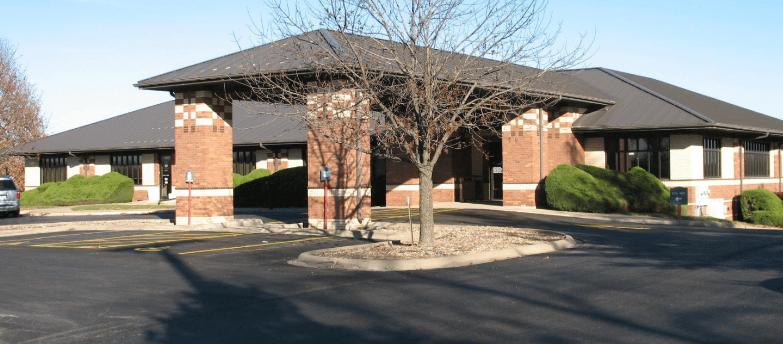
1-Mile | 3-Miles | 5-Miles | ||
---|---|---|---|---|
Total Population | 3,037 | 13,136 | 41,965 | |
Population Median Age | 38 | 37 | 36 | |
Population by Age | 0-9 Yrs | 502 (16%) | 2019 (15%) | 6488 (15%) |
10-19 Yrs | 397 (13%) | 2109 (16%) | 6723 (16%) | |
20-29 Yrs | 287 (9%) | 1152 (8%) | 3831 (9%) | |
30-39 Yrs | 397 (13%) | 1583 (12%) | 5709 (13%) | |
40-49 Yrs | 419 (13%) | 2205 (16%) | 7420 (17%) | |
50-59 Yrs | 366 (12%) | 1685 (12%) | 4957 (11%) | |
60-69 Yrs | 337 (11%) | 1286 (9%) | 3943 (9%) | |
70+ Yrs | 332 (10%) | 1097 (8%) | 2894 (6%) | |
Median HH Income | $56,955 | $79,897 | $94,484 | |
Total Household Income | < 24K | 235 (20%) | 611 (13%) | 1410 (9%) |
25-49K | 260 (22%) | 733 (16%) | 1737 (11%) | |
50-74K | 222 (19%) | 796 (17%) | 2334 (16%) | |
75-99K | 138 (12%) | 656 (14%) | 2275 (15%) | |
100-199K | 271 (23%) | 1472 (32%) | 5379 (37%) | |
200K+ | 8 (0%) | 269 (5%) | 1373 (9%) | |
Highest Education Level | No Diploma | 218 | 681 | 1302 |
Diploma or GED | 740 | 2625 | 6133 | |
Some College | 448 | 1824 | 5324 | |
Assoc. Degree | 144 | 635 | 2401 | |
Bachelors Degree | 302 | 1801 | 7524 | |
Higher Degree | 170 | 906 | 4159 | |
Total Housing Units | 1,149 | 4,807 | 15,167 | |
--Owner-Occupied | 690 | 3,433 | 11,330 | |
--Renter-Occupied | 444 | 1,105 | 3,177 | |
Owner-Occupied Values | < 100K | 116 | 555 | 938 |
100-199K | 440 | 1270 | 3354 | |
200-299K | 115 | 967 | 4180 | |
300-399K | 8 | 434 | 1930 | |
400-499K | 4 | 103 | 501 | |
500K+ | 7 | 103 | 427 | |
Total Working Age Population | 2,276 | 9,789 | 30,907 | |
In Work Force | 1,512 | 6,992 | 23,206 | |
Not In Work Force | 765 | 2,797 | 7,701 | |
Workforce Employed | 1,400 | 6,668 | 22,452 | |
Workforce Unemployed | 111 | 322 | 686 | |
Civlian Workforce | 1,512 | 6,990 | 23,137 | |
Military Workforce | 0 | 2 | 68 | |
Total Households | 1,134 | 4,538 | 14,507 | |
Family Households | 771 | 3,393 | 11,117 | |
Non-Family Households | 363 | 1,145 | 3,390 | |
Married Couple | 573 | 2,719 | 9,228 | |
Other Family | 198 | 674 | 1,889 | |
Married w/Child | 221 | 1,237 | 4,685 | |
Single Male w/Child | 1 | 42 | 292 | |
Single Female w/Child | 119 | 348 | 846 |
Population Change Last Two Decades - Plus Projection
2000 | % | 2010 | % | 2020 | % | 2030 | |
---|---|---|---|---|---|---|---|
Kansas | 2,688,418 | +6 | 2,853,118 | +5 | 2,988,194 | +5 | 3,140,008 |
Johnson County | 451,086 | +21 | 544,179 | +15 | 625,524 | +17 | 734,065 |
Leavenworth County | 68,691 | +11 | 76,227 | +10 | 83,566 | +11 | 92,787 |
Wyandotte County | 157,882 | 0 | 157,505 | +5 | 165,672 | +2 | 169,789 |
Total Working Age Population:
Total Households:
Total Working Age Population:
Total Households:
Total Working Age Population:
Total Households: