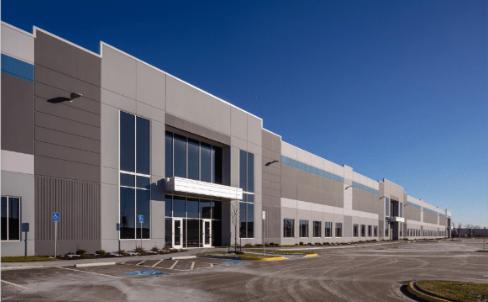
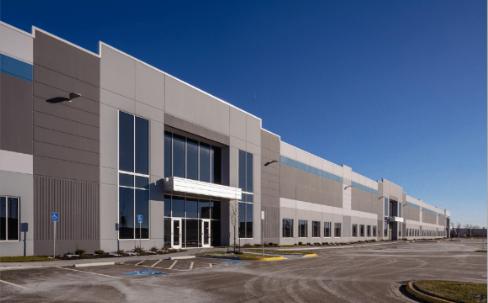
75,170 SF Build-to-Suit Opportunity
2,000 Amps at 480v 3-phase power
Pre-cast concrete construction - 28’ clear heights
High-bay LED fixtures with motion sensors to 30 foot-candles
Seven (7) equipped docks (expandable to 24)
– One (1) drive-in door
Parcel size: ±7 acres
Zoned M-2 - General Industrial District
100 Parking spaces
Quick access to I-35 and I-435
Pricing includes 3,750 SF of finished office area
10-Year 50% Property Tax Abatement
For Sale: $7,495,000 “turn key”
No part of this information may be copied, reproduced, repurposed, or screen-captured for any commercial purpose without prior written authorization from MyEListing.
While we strive to provide the most accurate information, all listing information, and demographic data, is provided by third-parties. As such, MyEListing will not be responsible for the accuracy of the information. It is strongly recommended that you verify all information with the listing agent, and any relevant agencies, prior to making any decisions.
What is the asking price for 1242 South Lone Elm Road in Olathe?
The asking price for 1242 South Lone Elm Road is $7,495,000
What is the building size of this Flex/Office Whs property in Olathe, KS?
The size of the building/unit at 1242 South Lone Elm Road in Olathe is 75,170 square feet
How much land does the Olathe, KS property at 1242 South Lone Elm Road include?
1242 South Lone Elm Road in Olathe includes 7.000 acres of land
What is the population within 1 mile of 1242 South Lone Elm Road in Olathe?
The population within 1 mile of 1242 South Lone Elm Road Olathe, KS 66061 is 4,217 people.
Who do I contact for questions about 1242 South Lone Elm Road?
You should contact the listing agent,
Logan Rose, for any details regarding this commercial listing.