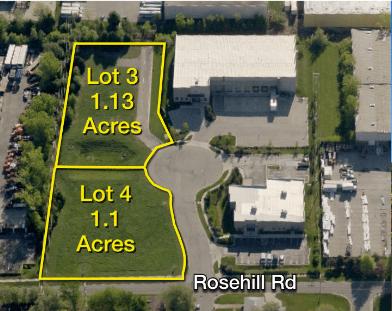
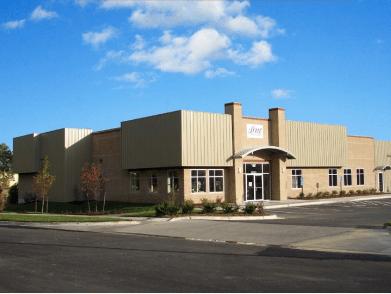
1-Mile | 3-Miles | 5-Miles | ||
---|---|---|---|---|
Total Population | 10,796 | 96,495 | 215,646 | |
Population Median Age | 40 | 39 | 39 | |
Population by Age | 0-9 Yrs | 1235 (11%) | 11500 (11%) | 24390 (11%) |
10-19 Yrs | 1097 (10%) | 10621 (11%) | 23947 (11%) | |
20-29 Yrs | 1751 (16%) | 15761 (16%) | 33411 (15%) | |
30-39 Yrs | 1725 (15%) | 14517 (15%) | 32442 (15%) | |
40-49 Yrs | 1113 (10%) | 10834 (11%) | 24421 (11%) | |
50-59 Yrs | 1389 (12%) | 12192 (12%) | 27741 (12%) | |
60-69 Yrs | 819 (7%) | 11228 (11%) | 25761 (11%) | |
70+ Yrs | 1666 (15%) | 9844 (10%) | 23534 (10%) | |
Median HH Income | $57,151 | $71,586 | $73,245 | |
Total Household Income | < 24K | 671 (14%) | 4364 (10%) | 10256 (11%) |
25-49K | 1311 (27%) | 8511 (21%) | 19182 (20%) | |
50-74K | 997 (21%) | 8273 (20%) | 17846 (19%) | |
75-99K | 590 (12%) | 5916 (14%) | 13622 (14%) | |
100-199K | 984 (20%) | 10963 (27%) | 24482 (26%) | |
200K+ | 144 (3%) | 2175 (5%) | 6783 (7%) | |
Highest Education Level | No Diploma | 767 | 3614 | 7058 |
Diploma or GED | 1585 | 11428 | 24931 | |
Some College | 1700 | 13918 | 29763 | |
Assoc. Degree | 633 | 5527 | 12183 | |
Bachelors Degree | 2129 | 21364 | 49523 | |
Higher Degree | 989 | 11111 | 28362 | |
Total Housing Units | 5,098 | 42,659 | 97,962 | |
--Owner-Occupied | 1,862 | 23,478 | 55,245 | |
--Renter-Occupied | 2,835 | 16,724 | 36,926 | |
Owner-Occupied Values | < 100K | 114 | 1029 | 2363 |
100-199K | 977 | 9443 | 19896 | |
200-299K | 584 | 10053 | 20834 | |
300-399K | 161 | 2112 | 7635 | |
400-499K | 14 | 590 | 2672 | |
500K+ | 11 | 252 | 1844 | |
Total Working Age Population | 8,903 | 78,616 | 177,001 | |
In Work Force | 6,175 | 57,655 | 127,593 | |
Not In Work Force | 2,728 | 20,961 | 49,408 | |
Workforce Employed | 6,005 | 55,573 | 123,604 | |
Workforce Unemployed | 169 | 2,039 | 3,882 | |
Civlian Workforce | 6,174 | 57,612 | 127,486 | |
Military Workforce | 2 | 43 | 107 | |
Total Households | 4,697 | 40,202 | 92,171 | |
Family Households | 2,521 | 24,622 | 54,938 | |
Non-Family Households | 2,176 | 15,580 | 37,233 | |
Married Couple | 1,679 | 18,458 | 42,236 | |
Other Family | 842 | 6,164 | 12,702 | |
Married w/Child | 608 | 6,947 | 15,973 | |
Single Male w/Child | 138 | 888 | 1,756 | |
Single Female w/Child | 356 | 2,639 | 5,420 |
Population Change Last Two Decades - Plus Projection
2000 | % | 2010 | % | 2020 | % | 2030 | |
---|---|---|---|---|---|---|---|
Kansas | 2,688,418 | +6 | 2,853,118 | +5 | 2,988,194 | +5 | 3,140,008 |
Johnson County | 451,086 | +21 | 544,179 | +15 | 625,524 | +17 | 734,065 |
Leavenworth County | 68,691 | +11 | 76,227 | +10 | 83,566 | +11 | 92,787 |
Wyandotte County | 157,882 | 0 | 157,505 | +5 | 165,672 | +2 | 169,789 |
Total Working Age Population:
Total Households:
Total Working Age Population:
Total Households:
Total Working Age Population:
Total Households: