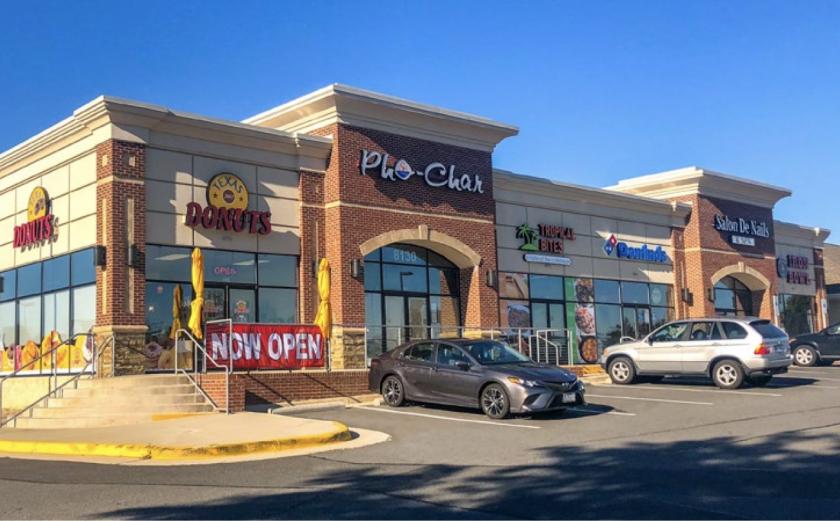
• Up to 6,400 SF per floor and up to 2 floors.
• ATM kiosk finished pad available: Front and center at signalized entrance. Site plan
approved & finished with all utilities stubbed to the site.
• New retail development with excellent visibility and access at the signalized intersection of Ashton Ave. (26,642 ADT) and Lomond Dr. (8,696 ADT).
• Generous monument signage available.
• Ample surface parking available.
• Approved Rosemount Lewis Elementary School next door with 900+ student capacity and scheduled to open September 2022.
No part of this information may be copied, reproduced, repurposed, or screen-captured for any commercial purpose without prior written authorization from MyEListing.
While we strive to provide the most accurate information, all listing information, and demographic data, is provided by third-parties. As such, MyEListing will not be responsible for the accuracy of the information. It is strongly recommended that you verify all information with the listing agent, and any relevant agencies, prior to making any decisions.
What kind of Land is the propery at 8130 Ashton Avenue?
The property at 8130 Ashton Avenue Manassas, VA 20109 is listed as a Retail Pad Site Land property
What is the population within 1 mile of 8130 Ashton Avenue in Manassas?
The population within 1 mile of 8130 Ashton Avenue Manassas, VA 20109 is 18,531 people.
Who do I contact for questions about 8130 Ashton Avenue?
You should contact the listing agent,
Kirk Cheney, for any details regarding this commercial listing.