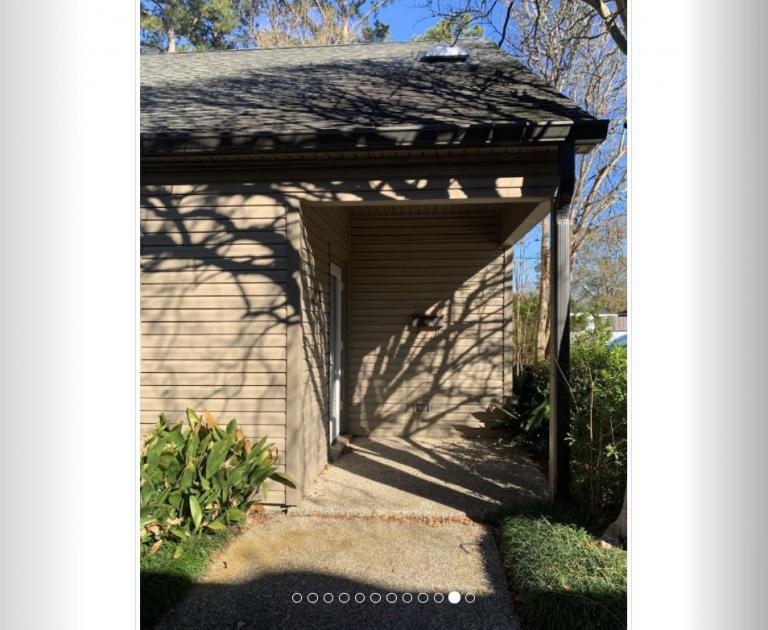
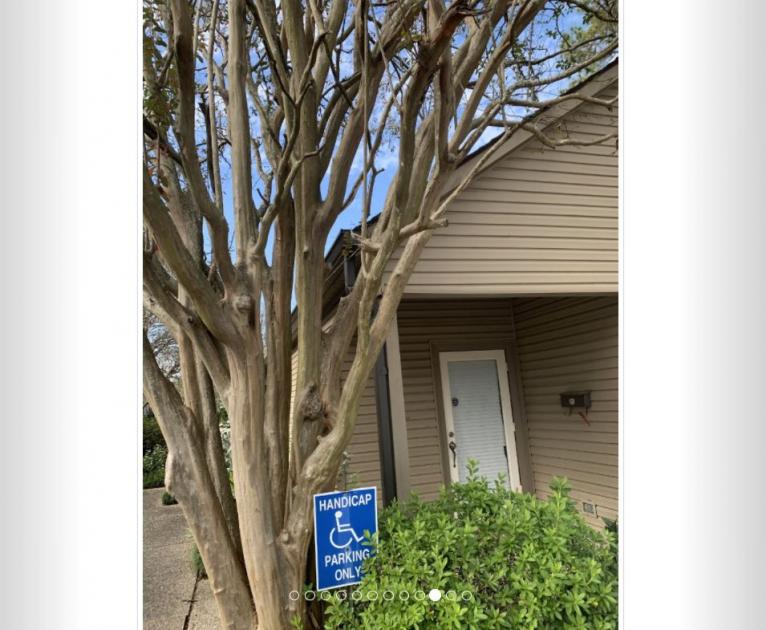
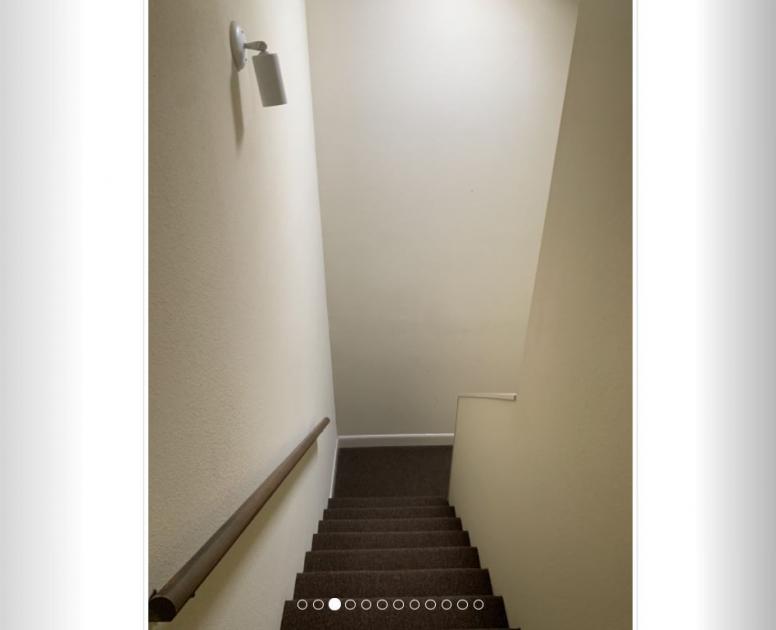
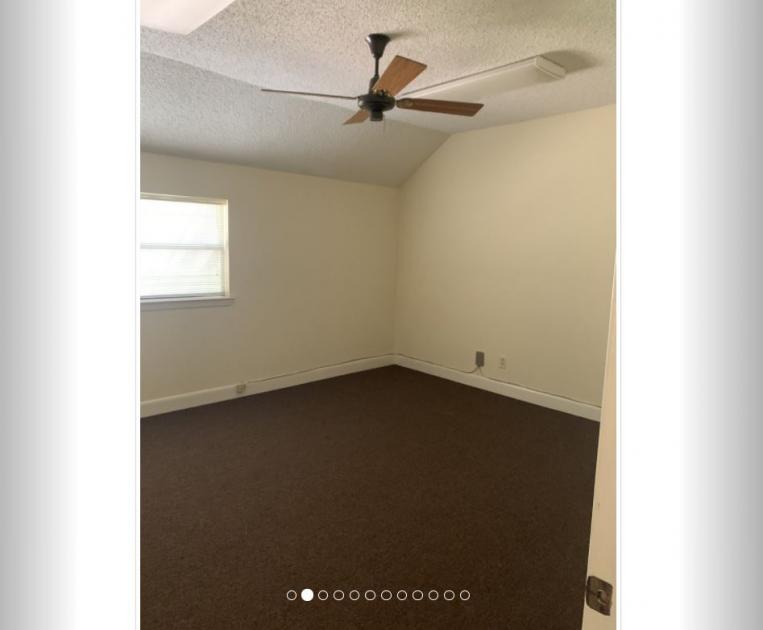
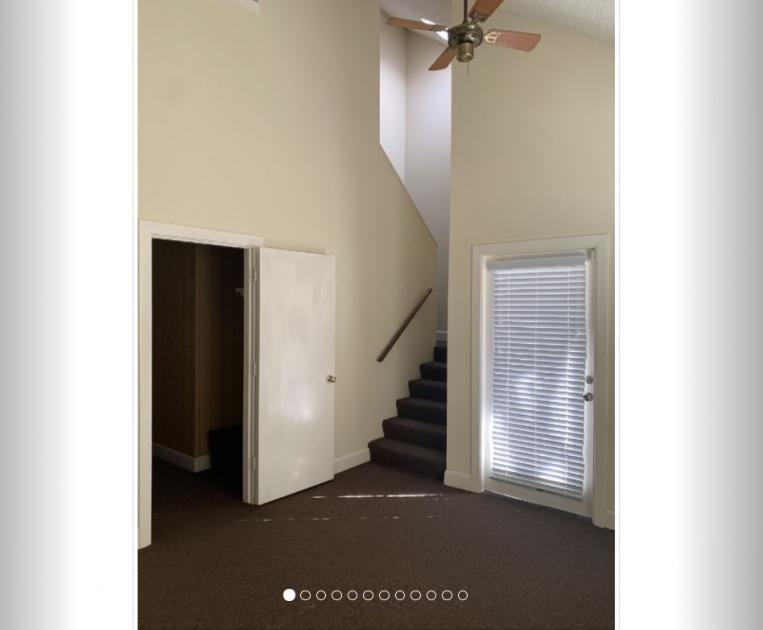
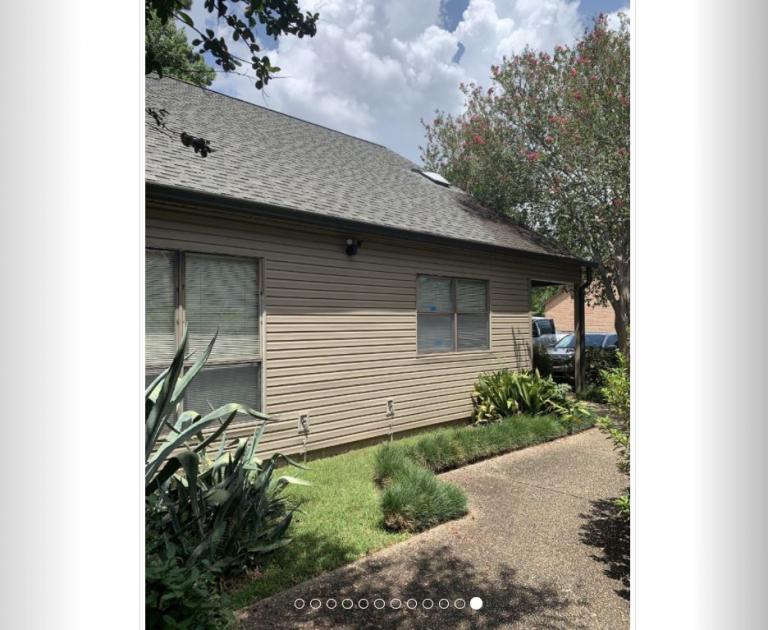
1-Mile | 3-Miles | 5-Miles | ||
---|---|---|---|---|
Total Population | 13,592 | 84,303 | 178,123 | |
Population Median Age | 35 | 38 | 38 | |
Population by Age | 0-9 Yrs | 1938 (14%) | 10236 (12%) | 22822 (12%) |
10-19 Yrs | 1131 (8%) | 9362 (11%) | 21422 (12%) | |
20-29 Yrs | 3877 (28%) | 15110 (17%) | 29137 (16%) | |
30-39 Yrs | 1771 (13%) | 12062 (14%) | 25958 (14%) | |
40-49 Yrs | 1291 (9%) | 9322 (11%) | 20696 (11%) | |
50-59 Yrs | 1302 (9%) | 10149 (12%) | 20798 (11%) | |
60-69 Yrs | 927 (6%) | 9124 (10%) | 19059 (10%) | |
70+ Yrs | 1355 (9%) | 8938 (10%) | 18230 (10%) | |
Median HH Income | $46,382 | $60,309 | $62,225 | |
Total Household Income | < 24K | 1167 (20%) | 5991 (17%) | 12327 (17%) |
25-49K | 1890 (33%) | 8114 (24%) | 15786 (22%) | |
50-74K | 1131 (20%) | 6287 (18%) | 12616 (18%) | |
75-99K | 472 (8%) | 4367 (12%) | 8551 (12%) | |
100-199K | 797 (14%) | 7351 (21%) | 15577 (22%) | |
200K+ | 185 (3%) | 1634 (4%) | 4593 (6%) | |
Highest Education Level | No Diploma | 349 | 3390 | 8586 |
Diploma or GED | 2525 | 15112 | 29451 | |
Some College | 2393 | 14792 | 29441 | |
Assoc. Degree | 648 | 3635 | 6834 | |
Bachelors Degree | 1883 | 14211 | 29304 | |
Higher Degree | 768 | 6331 | 15753 | |
Total Housing Units | 6,668 | 38,190 | 80,444 | |
--Owner-Occupied | 2,132 | 20,170 | 41,881 | |
--Renter-Occupied | 3,510 | 13,574 | 27,570 | |
Owner-Occupied Values | < 100K | 176 | 1561 | 3163 |
100-199K | 928 | 9454 | 18100 | |
200-299K | 693 | 6566 | 11115 | |
300-399K | 249 | 1746 | 5202 | |
400-499K | 49 | 421 | 1660 | |
500K+ | 37 | 422 | 2642 | |
Total Working Age Population | 11,021 | 68,804 | 142,578 | |
In Work Force | 8,154 | 47,359 | 96,496 | |
Not In Work Force | 2,867 | 21,445 | 46,082 | |
Workforce Employed | 7,593 | 45,204 | 92,096 | |
Workforce Unemployed | 546 | 2,108 | 4,262 | |
Civlian Workforce | 8,139 | 47,311 | 96,357 | |
Military Workforce | 15 | 47 | 139 | |
Total Households | 5,642 | 33,744 | 69,451 | |
Family Households | 2,866 | 19,132 | 41,102 | |
Non-Family Households | 2,776 | 14,612 | 28,350 | |
Married Couple | 1,622 | 12,740 | 28,096 | |
Other Family | 1,244 | 6,392 | 13,005 | |
Married w/Child | 547 | 4,400 | 10,558 | |
Single Male w/Child | 184 | 725 | 1,392 | |
Single Female w/Child | 472 | 2,439 | 5,000 |
Population Change Last Two Decades - Plus Projection
2000 | % | 2010 | % | 2020 | % | 2030 | |
---|---|---|---|---|---|---|---|
Louisiana | 4,468,976 | +1 | 4,533,372 | +1 | 4,588,310 | +5 | 4,813,420 |
East Baton Rouge Parish | 412,852 | +7 | 440,171 | -3 | 426,380 | -1 | 421,500 |
Iberville Parish | 33,320 | 0 | 33,387 | -17 | 27,830 | -11 | 24,640 |
Livingston Parish | 91,814 | +39 | 128,026 | +40 | 179,820 | +35 | 242,780 |
St. Martin Parish | 48,583 | +7 | 52,160 | +6 | 55,520 | +3 | 57,000 |
Total Working Age Population:
Total Households:
Total Working Age Population:
Total Households:
Total Working Age Population:
Total Households: