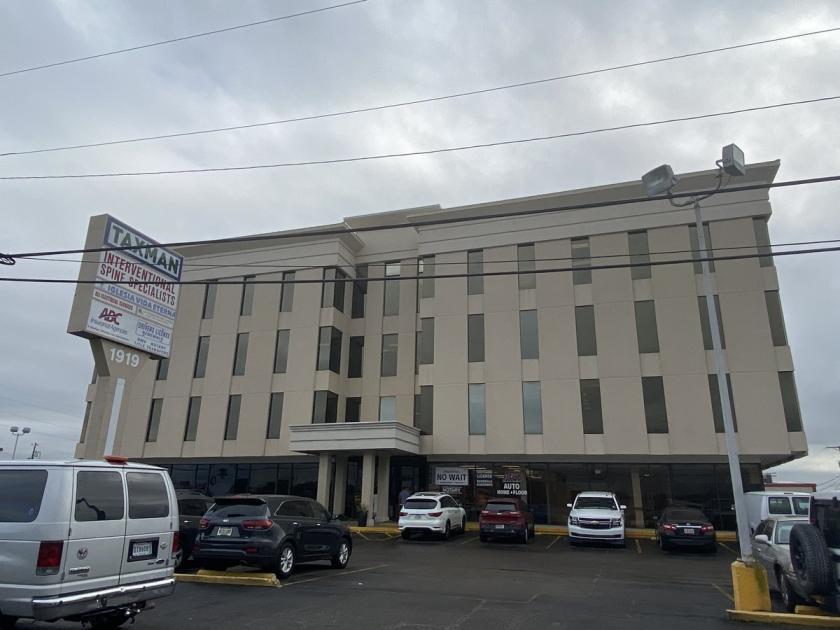
Office Space
1919 Veterans Memorial Boulevard Kenner, LA 70062
1919 Veterans Memorial Boulevard Kenner, LA 70062

Details & Description
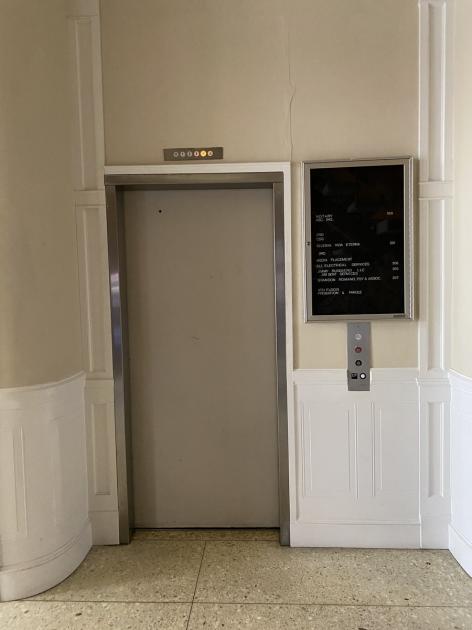
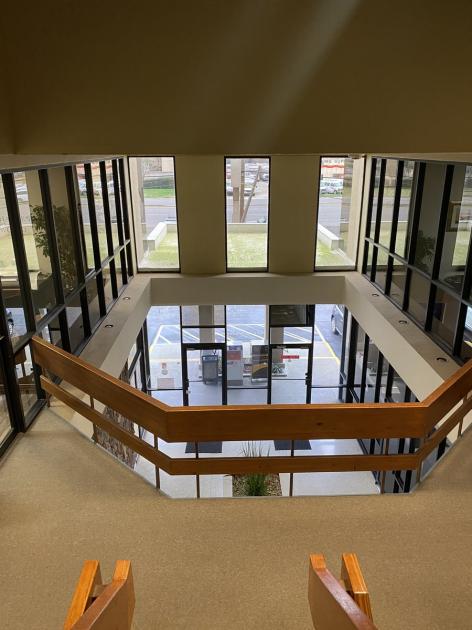
Additional Photos

Listing Agents

Chuck Pennewell
O: 504-525-1311
M: 913-645-7391
cpennewell@latterblum.com
O: 504-525-1311
M: 913-645-7391
cpennewell@latterblum.com

Stephanie Koontz
O: 504-525-1311
M: 610-248-0690
skoontz@latterblum.com
O: 504-525-1311
M: 610-248-0690
skoontz@latterblum.com
While we strive to provide the most accurate information, all listing information, and demographic data, is provided by third-parties. As such, MyEListing will not be responsible for the accuracy of the information. It is strongly recommended that you verify all information with the listing agent, and any relevant agencies, prior to making any decisions.


