Industrial Properties
58785 Executive Drive Mishawaka, IN 46544
58785 Executive Drive Mishawaka, IN 46544
Details & Description
Property Highlights
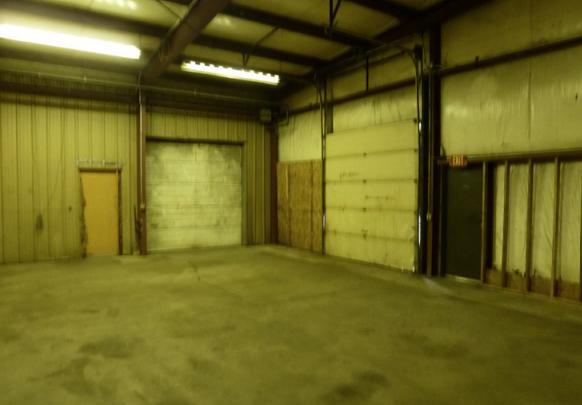
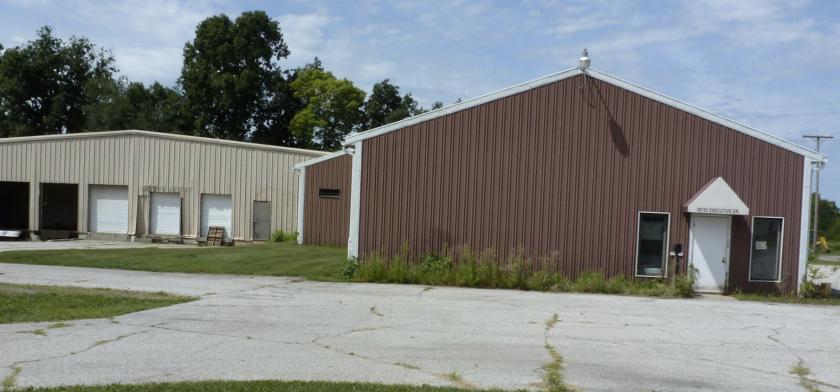
• Owner-occupied 30,720 SF multi-tenant industrial building
• 1 Suite Available - 9,920 SF
Listing Agents

Tony Davey
O: 574-271-4060
M: 574-485-1536
tdavey@cressy.com
O: 574-271-4060
M: 574-485-1536
tdavey@cressy.com
While we strive to provide the most accurate information, all listing information, and demographic data, is provided by third-parties. As such, MyEListing will not be responsible for the accuracy of the information. It is strongly recommended that you verify all information with the listing agent, and any relevant agencies, prior to making any decisions.