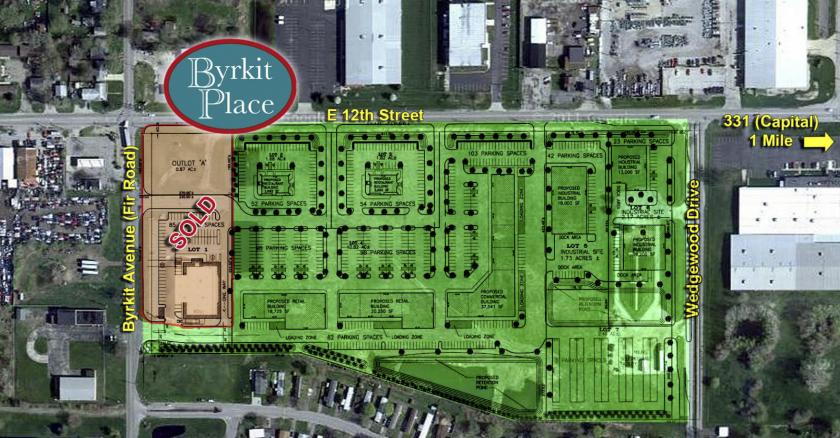
1-Mile | 3-Miles | 5-Miles | ||
---|---|---|---|---|
Total Population | 7,238 | 48,198 | 117,396 | |
Population Median Age | 37 | 38 | 38 | |
Population by Age | 0-9 Yrs | 1172 (16%) | 6393 (13%) | 14816 (12%) |
10-19 Yrs | 1001 (13%) | 6256 (12%) | 16218 (13%) | |
20-29 Yrs | 1011 (13%) | 7375 (15%) | 17982 (15%) | |
30-39 Yrs | 864 (11%) | 5716 (11%) | 14869 (12%) | |
40-49 Yrs | 778 (10%) | 5556 (11%) | 13799 (11%) | |
50-59 Yrs | 827 (11%) | 5970 (12%) | 14318 (12%) | |
60-69 Yrs | 958 (13%) | 5965 (12%) | 13559 (11%) | |
70+ Yrs | 626 (8%) | 4967 (10%) | 11835 (10%) | |
Median HH Income | $48,306 | $46,165 | $47,891 | |
Total Household Income | < 24K | 597 (21%) | 4916 (24%) | 11465 (24%) |
25-49K | 875 (30%) | 5854 (29%) | 13417 (28%) | |
50-74K | 709 (25%) | 3851 (19%) | 9038 (18%) | |
75-99K | 314 (11%) | 2300 (11%) | 5589 (11%) | |
100-199K | 321 (11%) | 2511 (12%) | 7056 (14%) | |
200K+ | 19 (0%) | 377 (1%) | 1115 (2%) | |
Highest Education Level | No Diploma | 417 | 3944 | 8305 |
Diploma or GED | 1824 | 11393 | 24991 | |
Some College | 1059 | 6588 | 15939 | |
Assoc. Degree | 334 | 2762 | 6737 | |
Bachelors Degree | 651 | 5197 | 13750 | |
Higher Degree | 340 | 2459 | 8323 | |
Total Housing Units | 3,120 | 22,586 | 55,338 | |
--Owner-Occupied | 2,152 | 12,443 | 29,542 | |
--Renter-Occupied | 684 | 7,367 | 18,138 | |
Owner-Occupied Values | < 100K | 1010 | 5856 | 12669 |
100-199K | 968 | 4939 | 12384 | |
200-299K | 134 | 1048 | 2715 | |
300-399K | 12 | 225 | 842 | |
400-499K | 1 | 78 | 279 | |
500K+ | 27 | 298 | 654 | |
Total Working Age Population | 5,440 | 37,967 | 92,804 | |
In Work Force | 3,411 | 24,658 | 60,613 | |
Not In Work Force | 2,028 | 13,309 | 32,192 | |
Workforce Employed | 3,235 | 23,481 | 57,802 | |
Workforce Unemployed | 174 | 1,113 | 2,709 | |
Civlian Workforce | 3,409 | 24,595 | 60,511 | |
Military Workforce | 3 | 63 | 102 | |
Total Households | 2,836 | 19,810 | 47,680 | |
Family Households | 1,821 | 11,488 | 27,451 | |
Non-Family Households | 1,015 | 8,323 | 20,229 | |
Married Couple | 1,173 | 7,861 | 19,305 | |
Other Family | 649 | 3,627 | 8,146 | |
Married w/Child | 389 | 2,912 | 7,372 | |
Single Male w/Child | 188 | 562 | 1,261 | |
Single Female w/Child | 267 | 1,482 | 3,367 |
Population Change Last Two Decades - Plus Projection
2000 | % | 2010 | % | 2020 | % | 2030 | |
---|---|---|---|---|---|---|---|
Indiana | 6,080,485 | +7 | 6,483,802 | +4 | 6,738,573 | +4 | 7,014,880 |
Elkhart County | 182,791 | +8 | 197,559 | +6 | 209,690 | +7 | 223,392 |
St. Joseph County | 265,559 | +1 | 266,931 | +1 | 269,113 | +1 | 271,912 |
Total Working Age Population:
Total Households:
Total Working Age Population:
Total Households:
Total Working Age Population:
Total Households: