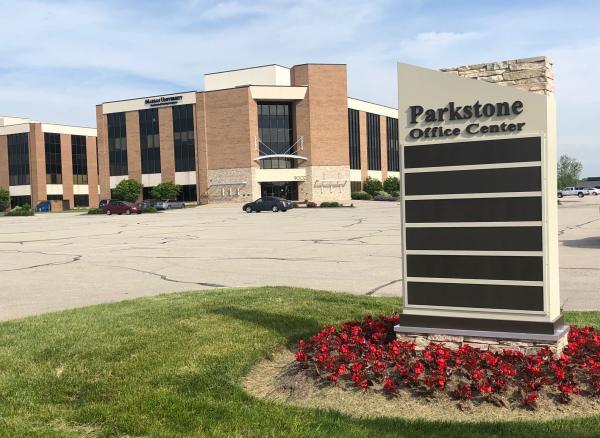
Office Space
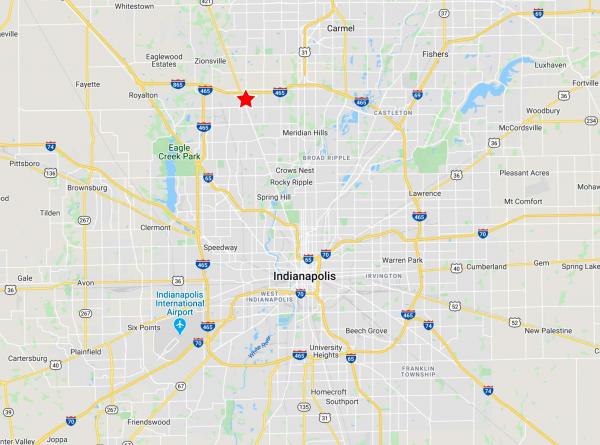
9002 Purdue Road Indianapolis, IN 46268
9002 Purdue Road Indianapolis, IN 46268
Details & Description
Property Highlights
- • 200,000 SF four building office complex
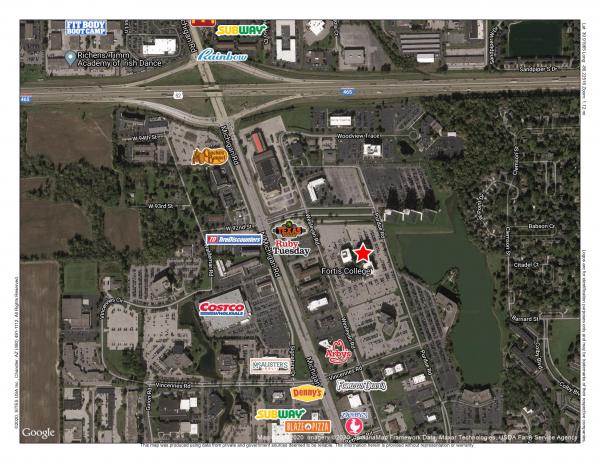
- • Close to major retailers, hotels and restaurants
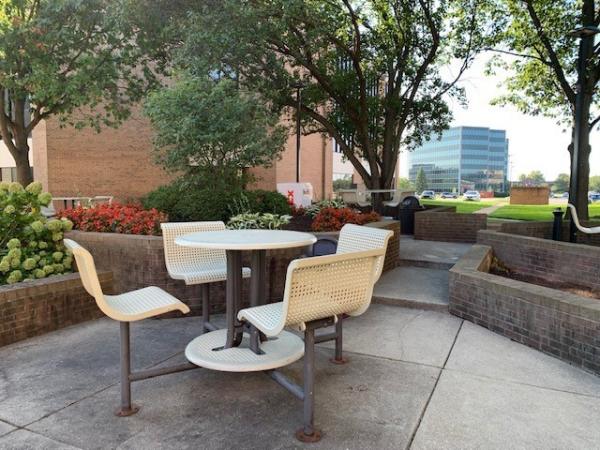
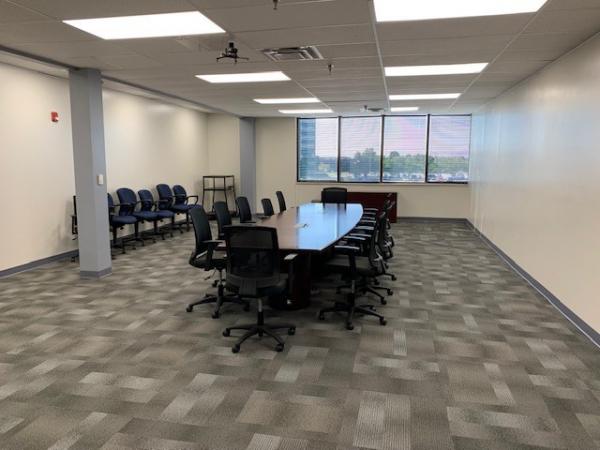
- • Conference room and fitness center
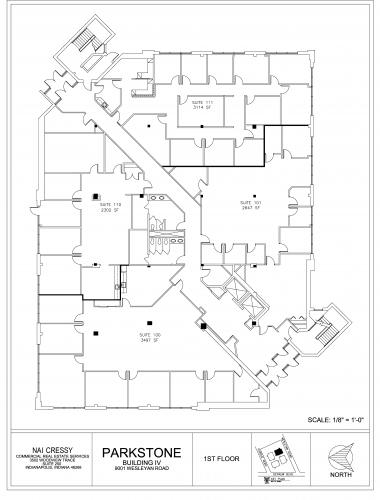
- • Various suite sizes available
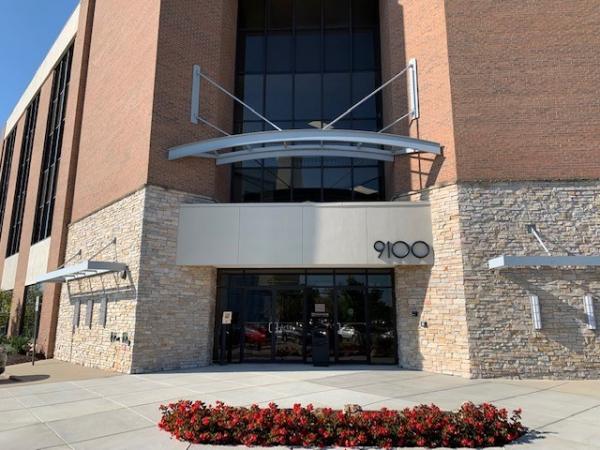
- • Convenient surface parking
- • Efficient floor plates
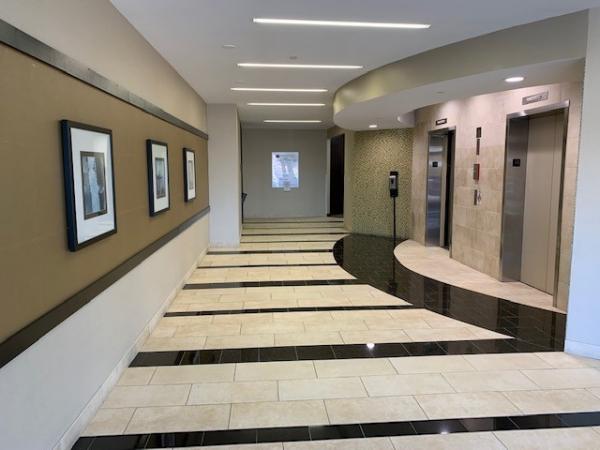
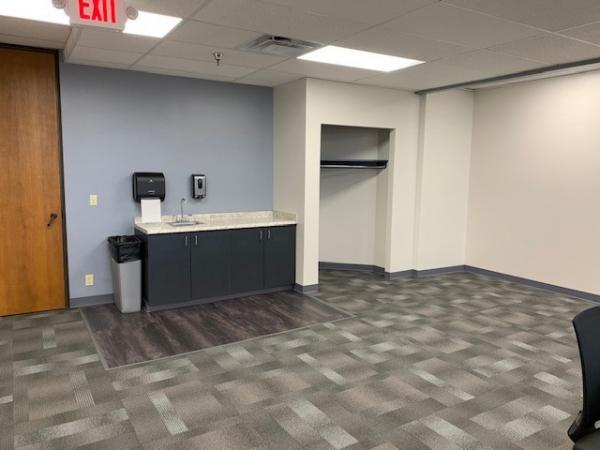
Additional Photos
Listing Agents

Andrew Follman
O: 317-566-5614
M: 317-294-3576
afollman@cressy.com
O: 317-566-5614
M: 317-294-3576
afollman@cressy.com

Luke Troyer
O: 574-261-8912
ltroyer@cressy.com
O: 574-261-8912
ltroyer@cressy.com
While we strive to provide the most accurate information, all listing information, and demographic data, is provided by third-parties. As such, MyEListing will not be responsible for the accuracy of the information. It is strongly recommended that you verify all information with the listing agent, and any relevant agencies, prior to making any decisions.