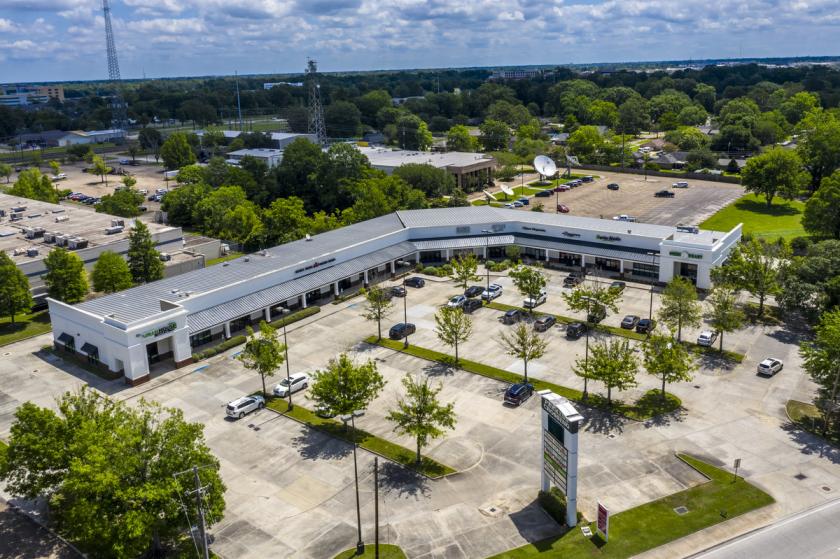
Perkins Crossing is 30,000 SF shopping center with a brand new look located near the heavily trafficked intersection of Essen Lane (30,000 VPD) and Perkins Road (29,523 VPD).
Situated in between two major hospitals, Our Lady of the Lake Regional Medical Center and Baton Rouge General Medical Center, with a combined 1,388 hospital beds.
Benefits from its proximity to The Mall of Louisiana, Louisiana's largest shopping mall, a 1.5 million square foot development with over 160 stores and 15 million annual visitors.
Prime pylon signage opportunity available along Perkins Road.
NNNs are an estimated $4.50/SF.
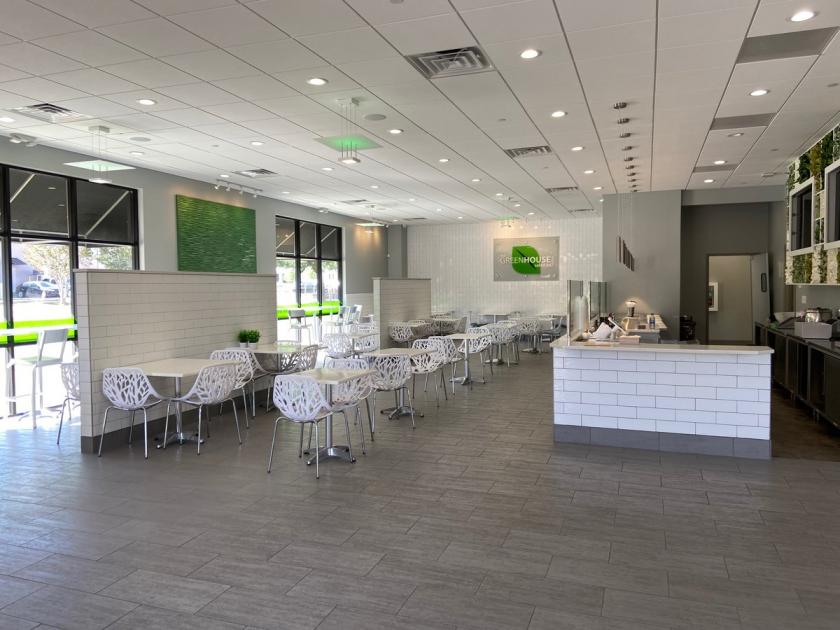
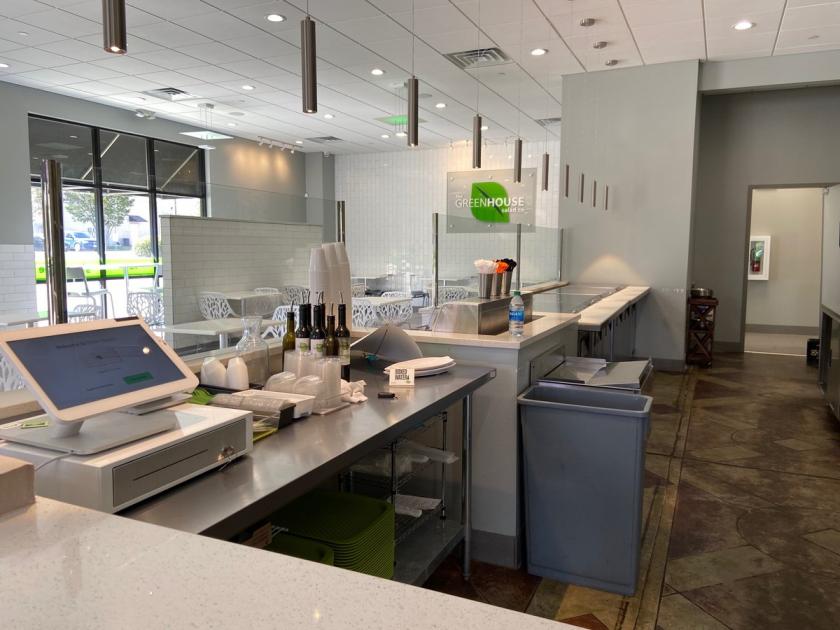
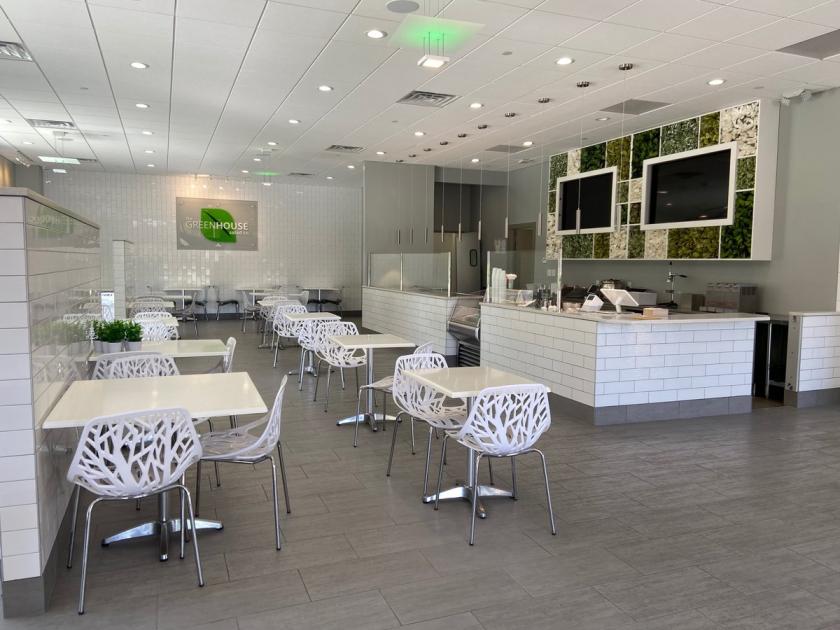
Retail availabilities include:
3,060 SF (Suite 100) - former Greenhouse Salad Co. space that comes equipped with restaurant FF&E.
3,060 SF (Suite 110) - former Snap Fitness space is a turn-key space for another fitness user.
1,974 SF (Suite 130) - former AT&T space is in white-box condition.
1,800 SF (Suite 135) - former pharmacy is in white-box condition.
No part of this information may be copied, reproduced, repurposed, or screen-captured for any commercial purpose without prior written authorization from MyEListing.
While we strive to provide the most accurate information, all listing information, and demographic data, is provided by third-parties. As such, MyEListing will not be responsible for the accuracy of the information. It is strongly recommended that you verify all information with the listing agent, and any relevant agencies, prior to making any decisions.
What is the asking price for 7731 Perkins Road in Baton Rouge?
The asking price for 7731 Perkins Road is $19.00 a SF per Year
What is the building size of this commercial Retail property?
The size of this multi-unit property varies between 1800 - 3060 square feet
What kind of Retail is the propery at 7731 Perkins Road?
The property at 7731 Perkins Road Baton Rouge, LA 70810 is listed as a Free Standing Building Retail property
What is the population within 1 mile of 7731 Perkins Road in Baton Rouge?
The population within 1 mile of 7731 Perkins Road Baton Rouge, LA 70810 is 7,294 people.
Who do I contact for questions about 7731 Perkins Road?
You should contact the listing agent,
Andrew DOstilio, for any details regarding this commercial listing.