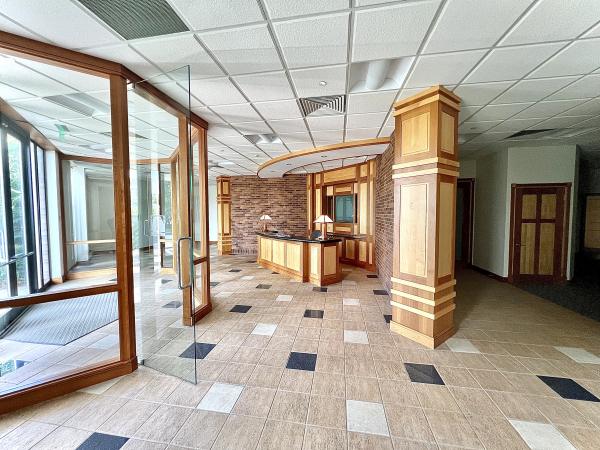
Office Space
550 Union Street Mishawaka, IN 46544
550 Union Street Mishawaka, IN 46544
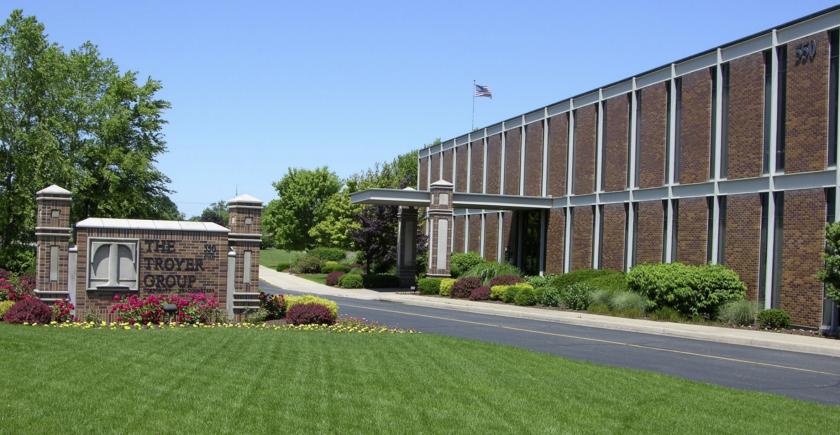
Details & Description
Property Highlights
- • Price reduced!
- • Can be single tenant or multi-tenant
- • Located in an Opportunity Zone
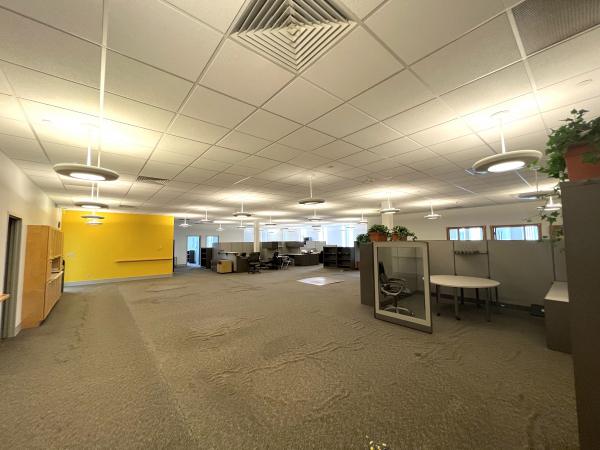
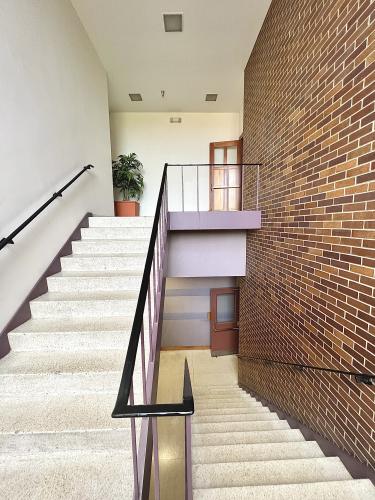
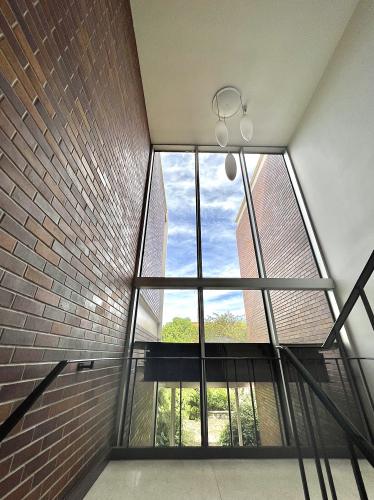
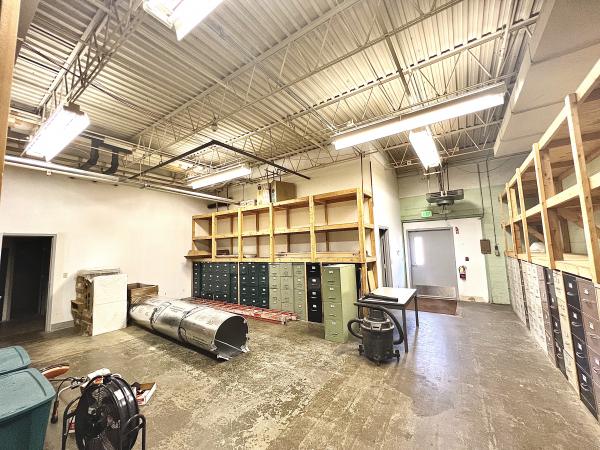
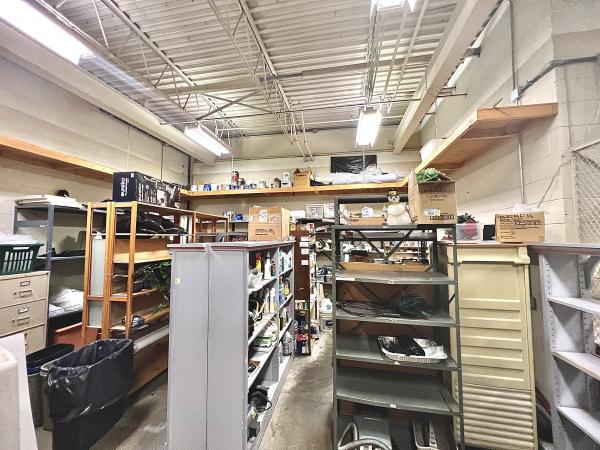
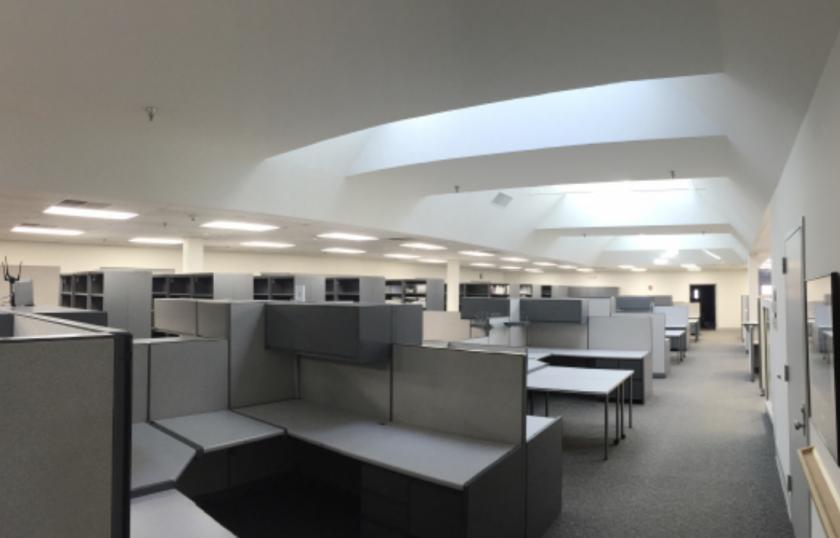
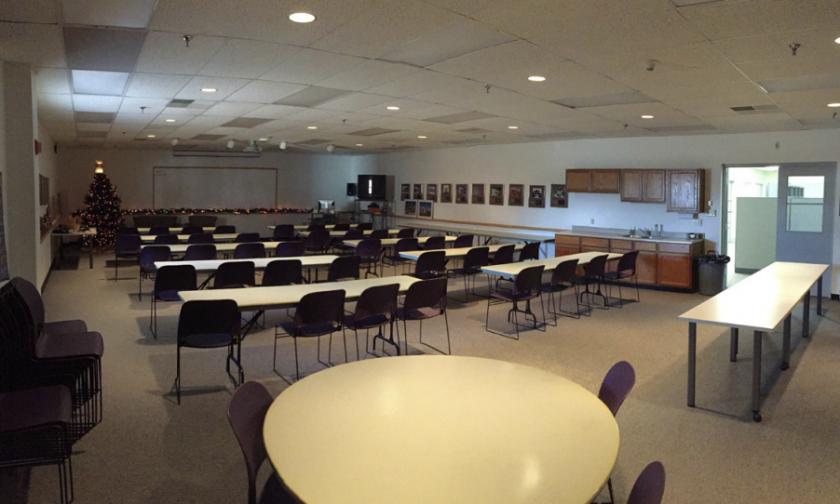
Additional Photos

Listing Agents

Richard Doolittle
O: 574-271-4060
M: 574-485-1535
rdoolittle@cressy.com
O: 574-271-4060
M: 574-485-1535
rdoolittle@cressy.com

Luke Troyer
O: 574-261-8912
ltroyer@cressy.com
O: 574-261-8912
ltroyer@cressy.com
While we strive to provide the most accurate information, all listing information, and demographic data, is provided by third-parties. As such, MyEListing will not be responsible for the accuracy of the information. It is strongly recommended that you verify all information with the listing agent, and any relevant agencies, prior to making any decisions.