Specialty Real Estate
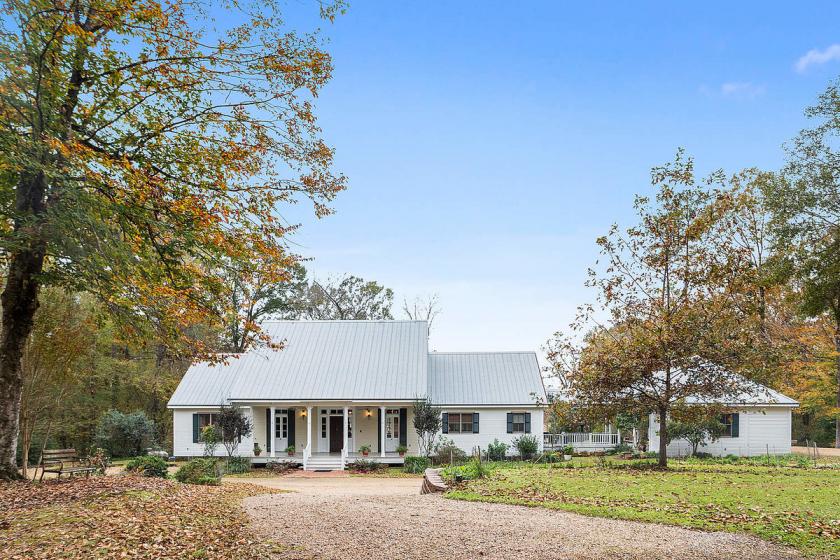
7463 Tunica Trace Saint Francisville, LA 70775
7463 Tunica Trace Saint Francisville, LA 70775
Details & Description
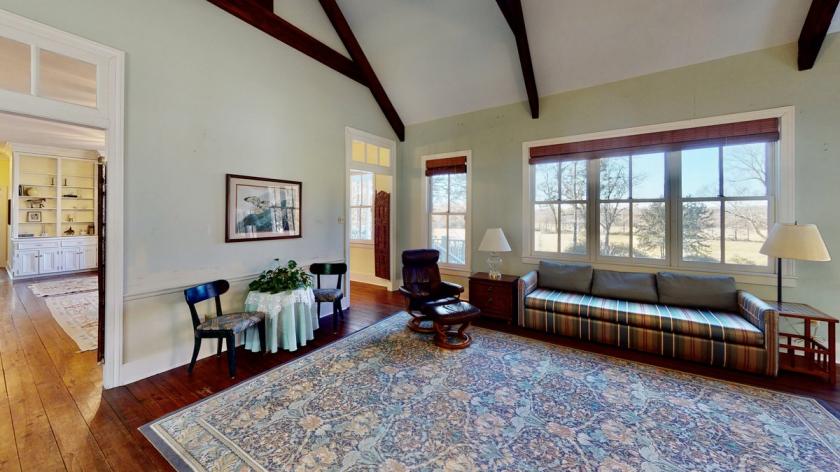
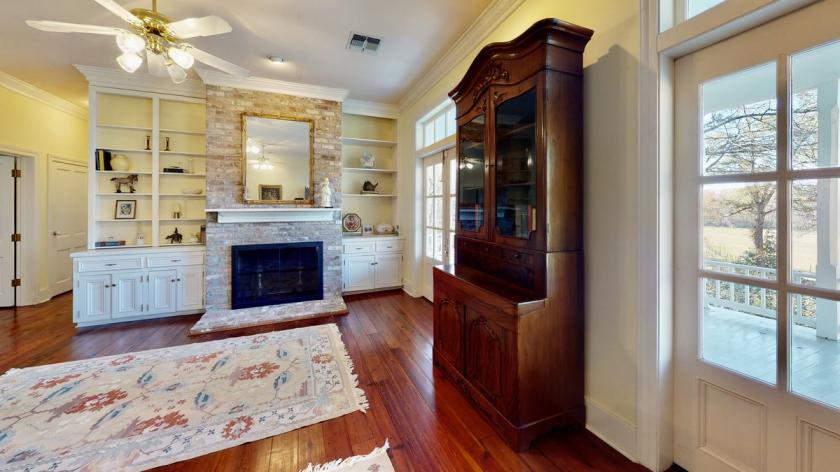
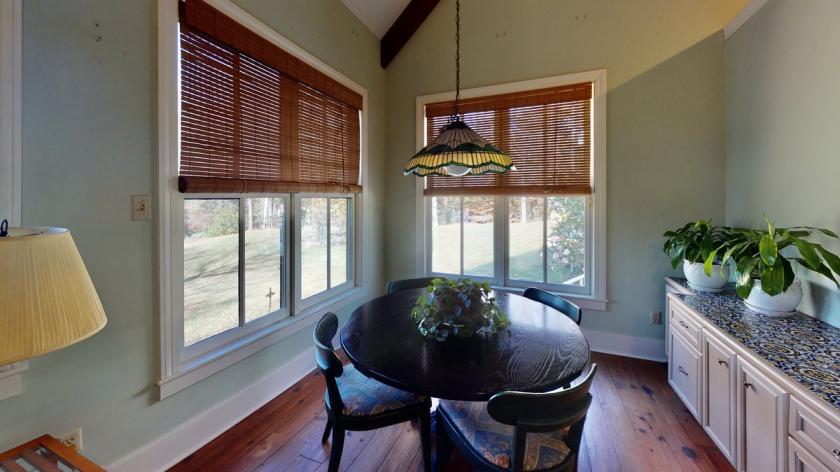
Additional Photos

Listing Agents

David Boudreaux
O: 225-295-0800
dfboudreaux@latterblum.com
O: 225-295-0800
dfboudreaux@latterblum.com
While we strive to provide the most accurate information, all listing information, and demographic data, is provided by third-parties. As such, MyEListing will not be responsible for the accuracy of the information. It is strongly recommended that you verify all information with the listing agent, and any relevant agencies, prior to making any decisions.


