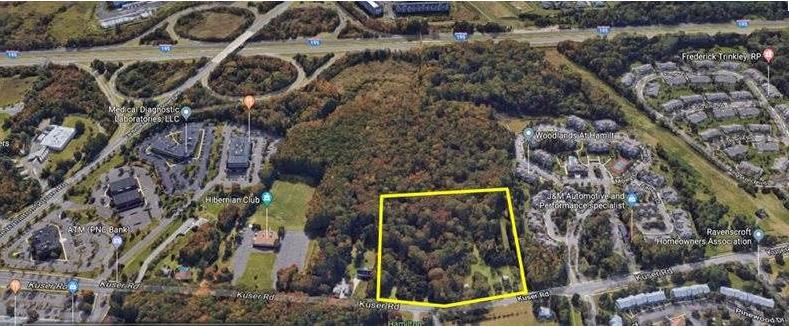
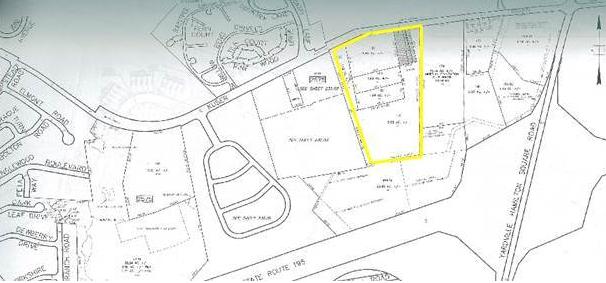
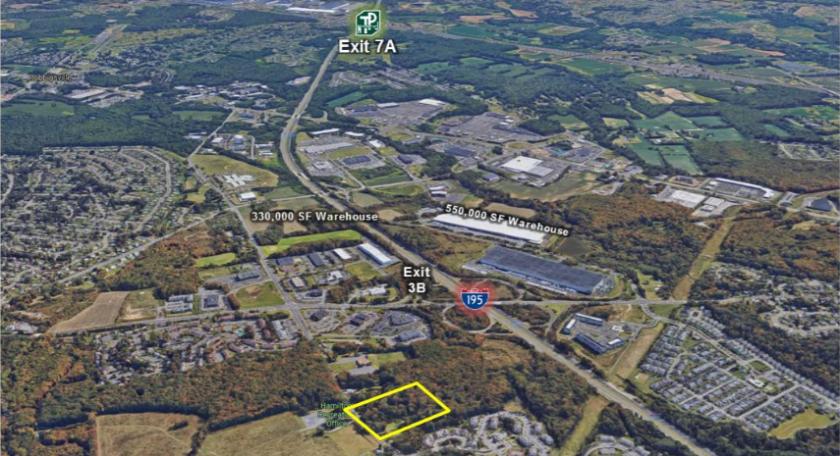
1-Mile | 3-Miles | 5-Miles | ||
---|---|---|---|---|
Total Population | 6,968 | 66,784 | 181,191 | |
Population Median Age | 45 | 42 | 39 | |
Population by Age | 0-9 Yrs | 569 (8%) | 6235 (9%) | 21232 (11%) |
10-19 Yrs | 645 (9%) | 6566 (9%) | 21740 (11%) | |
20-29 Yrs | 791 (11%) | 9574 (14%) | 26462 (14%) | |
30-39 Yrs | 985 (14%) | 8701 (13%) | 25707 (14%) | |
40-49 Yrs | 692 (9%) | 7843 (11%) | 24467 (13%) | |
50-59 Yrs | 949 (13%) | 10055 (15%) | 24744 (13%) | |
60-69 Yrs | 1164 (16%) | 9318 (13%) | 20247 (11%) | |
70+ Yrs | 1172 (16%) | 8493 (12%) | 16592 (9%) | |
Median HH Income | $88,832 | $85,048 | $71,803 | |
Total Household Income | < 24K | 267 (9%) | 3153 (12%) | 10912 (17%) |
25-49K | 477 (16%) | 4160 (15%) | 11750 (18%) | |
50-74K | 420 (14%) | 4017 (15%) | 10579 (16%) | |
75-99K | 509 (17%) | 4260 (16%) | 8868 (13%) | |
100-199K | 1010 (34%) | 8072 (30%) | 16064 (25%) | |
200K+ | 209 (7%) | 2422 (9%) | 5599 (8%) | |
Highest Education Level | No Diploma | 284 | 3405 | 19033 |
Diploma or GED | 1587 | 15198 | 38147 | |
Some College | 1217 | 9929 | 24227 | |
Assoc. Degree | 421 | 3952 | 7919 | |
Bachelors Degree | 1335 | 11178 | 22905 | |
Higher Degree | 565 | 5427 | 12971 | |
Total Housing Units | 3,094 | 27,567 | 70,840 | |
--Owner-Occupied | 2,308 | 19,143 | 40,440 | |
--Renter-Occupied | 584 | 6,941 | 23,331 | |
Owner-Occupied Values | < 100K | 65 | 579 | 5360 |
100-199K | 445 | 3811 | 9674 | |
200-299K | 1219 | 8481 | 12656 | |
300-399K | 435 | 4166 | 6915 | |
400-499K | 124 | 1392 | 3066 | |
500K+ | 19 | 715 | 2769 | |
Total Working Age Population | 5,974 | 56,602 | 147,170 | |
In Work Force | 3,841 | 37,688 | 96,724 | |
Not In Work Force | 2,133 | 18,914 | 50,446 | |
Workforce Employed | 3,710 | 35,887 | 90,556 | |
Workforce Unemployed | 132 | 1,771 | 5,997 | |
Civlian Workforce | 3,841 | 37,658 | 96,553 | |
Military Workforce | 0 | 30 | 172 | |
Total Households | 2,892 | 26,084 | 63,772 | |
Family Households | 1,934 | 16,819 | 42,666 | |
Non-Family Households | 958 | 9,265 | 21,106 | |
Married Couple | 1,553 | 12,708 | 29,369 | |
Other Family | 381 | 4,111 | 13,297 | |
Married w/Child | 516 | 4,367 | 11,985 | |
Single Male w/Child | 35 | 318 | 1,141 | |
Single Female w/Child | 50 | 1,092 | 4,779 |
Population Change Last Two Decades - Plus Projection
2000 | % | 2010 | % | 2020 | % | 2030 | |
---|---|---|---|---|---|---|---|
New Jersey | 8,414,350 | +4 | 8,791,894 | +4 | 9,132,700 | +4 | 9,530,900 |
Burlington County | 423,394 | +6 | 448,734 | 0 | 450,000 | +3 | 464,900 |
Mercer County | 350,761 | +4 | 366,513 | +3 | 379,000 | +5 | 397,400 |
Middlesex County | 750,162 | +8 | 809,858 | +8 | 873,400 | +7 | 932,200 |
Monmouth County | 615,301 | +2 | 630,380 | 0 | 633,400 | +3 | 655,300 |
Pennsylvania | 12,281,054 | +3 | 12,702,379 | +4 | 13,230,170 | +4 | 13,759,594 |
Bucks County | 597,635 | +5 | 625,249 | +1 | 629,420 | +1 | 637,730 |
Total Working Age Population:
Total Households:
Total Working Age Population:
Total Households:
Total Working Age Population:
Total Households: