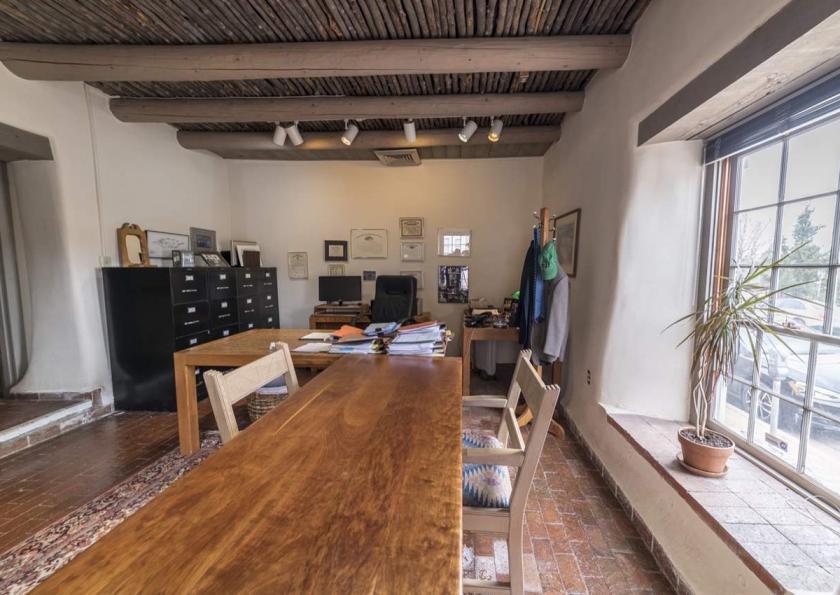
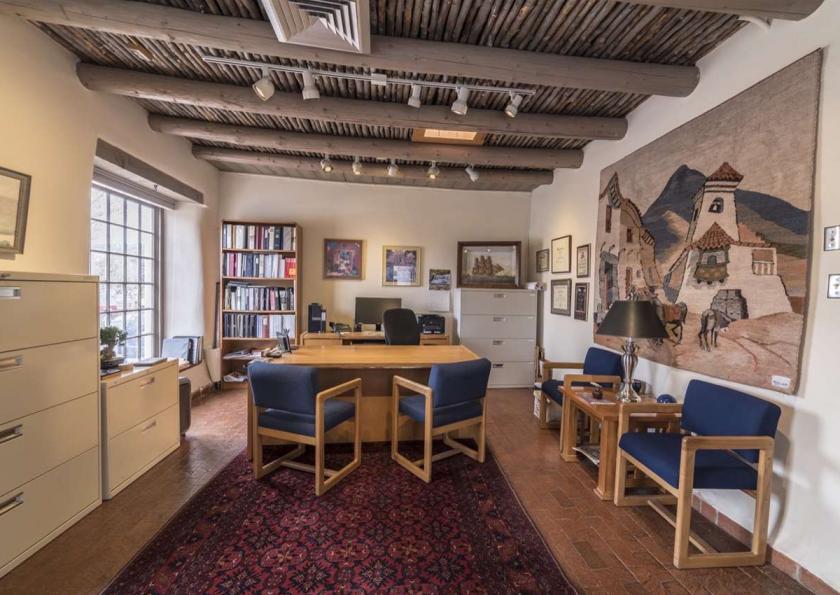
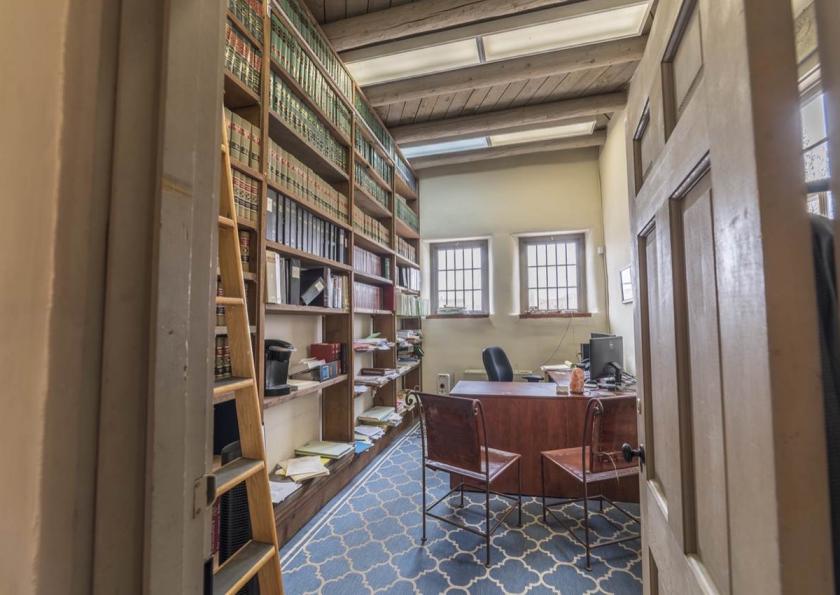
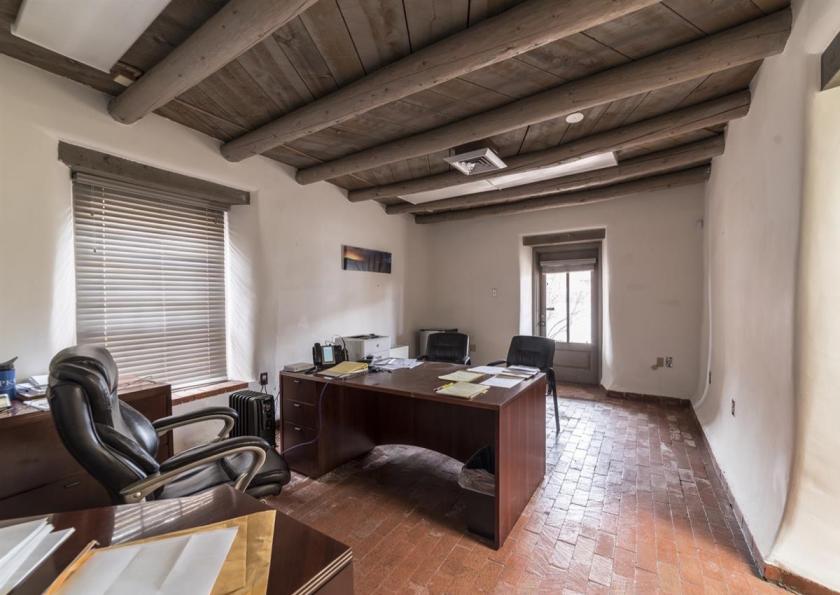
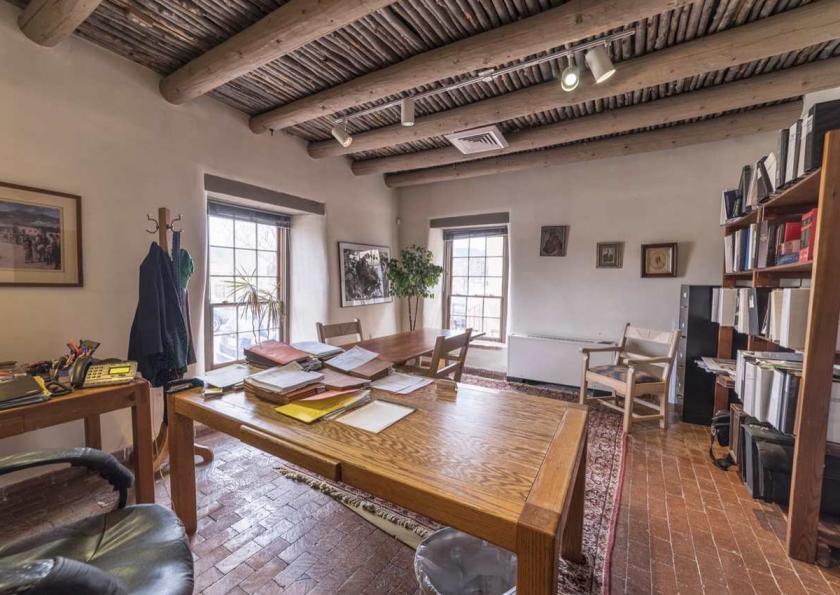
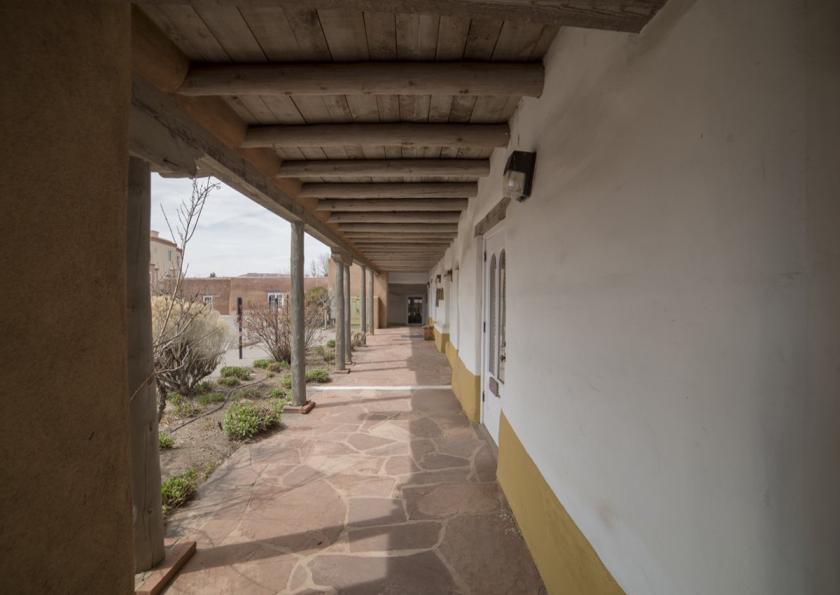
1-Mile | 3-Miles | 5-Miles | ||
---|---|---|---|---|
Total Population | 7,150 | 34,402 | 59,481 | |
Population Median Age | 51 | 49 | 48 | |
Population by Age | 0-9 Yrs | 371 (5%) | 2150 (6%) | 4105 (6%) |
10-19 Yrs | 311 (4%) | 2424 (7%) | 5359 (9%) | |
20-29 Yrs | 670 (9%) | 2986 (8%) | 5578 (9%) | |
30-39 Yrs | 968 (13%) | 4178 (12%) | 7074 (11%) | |
40-49 Yrs | 676 (9%) | 4059 (11%) | 6851 (11%) | |
50-59 Yrs | 973 (13%) | 4584 (13%) | 8241 (13%) | |
60-69 Yrs | 1552 (21%) | 6636 (19%) | 10732 (18%) | |
70+ Yrs | 1630 (22%) | 7385 (21%) | 11541 (19%) | |
Median HH Income | $63,075 | $63,255 | $60,812 | |
Total Household Income | < 24K | 853 (21%) | 3271 (19%) | 5167 (18%) |
25-49K | 787 (20%) | 3685 (21%) | 6444 (23%) | |
50-74K | 626 (15%) | 2819 (16%) | 4820 (17%) | |
75-99K | 457 (11%) | 1982 (11%) | 3369 (12%) | |
100-199K | 886 (22%) | 3600 (21%) | 5660 (20%) | |
200K+ | 311 (7%) | 1505 (8%) | 2211 (7%) | |
Highest Education Level | No Diploma | 356 | 2007 | 3921 |
Diploma or GED | 943 | 4998 | 9129 | |
Some College | 979 | 4942 | 8577 | |
Assoc. Degree | 309 | 1490 | 2763 | |
Bachelors Degree | 1707 | 7262 | 11090 | |
Higher Degree | 1997 | 7962 | 12108 | |
Total Housing Units | 5,755 | 21,710 | 33,867 | |
--Owner-Occupied | 2,010 | 9,835 | 17,262 | |
--Renter-Occupied | 1,910 | 7,027 | 10,410 | |
Owner-Occupied Values | < 100K | 89 | 453 | 1143 |
100-199K | 198 | 1021 | 2135 | |
200-299K | 239 | 1797 | 4057 | |
300-399K | 369 | 1883 | 3075 | |
400-499K | 267 | 1079 | 1691 | |
500K+ | 849 | 3601 | 5160 | |
Total Working Age Population | 6,593 | 30,860 | 52,486 | |
In Work Force | 3,880 | 17,806 | 30,181 | |
Not In Work Force | 2,713 | 13,054 | 22,305 | |
Workforce Employed | 3,694 | 16,947 | 28,838 | |
Workforce Unemployed | 180 | 841 | 1,324 | |
Civlian Workforce | 3,874 | 17,788 | 30,162 | |
Military Workforce | 6 | 18 | 19 | |
Total Households | 3,920 | 16,861 | 27,672 | |
Family Households | 1,589 | 7,952 | 14,101 | |
Non-Family Households | 2,331 | 8,910 | 13,571 | |
Married Couple | 1,189 | 5,723 | 10,220 | |
Other Family | 401 | 2,229 | 3,882 | |
Married w/Child | 166 | 1,075 | 2,380 | |
Single Male w/Child | 44 | 212 | 458 | |
Single Female w/Child | 120 | 795 | 1,387 |
Population Change Last Two Decades - Plus Projection
2000 | % | 2010 | % | 2020 | % | 2030 | |
---|---|---|---|---|---|---|---|
New Mexico | 1,819,046 | +13 | 2,059,179 | +6 | 2,187,183 | +6 | 2,308,475 |
Santa Fe County | 129,292 | +12 | 144,170 | +5 | 151,767 | +7 | 162,782 |
Total Working Age Population:
Total Households:
Total Working Age Population:
Total Households:
Total Working Age Population:
Total Households: