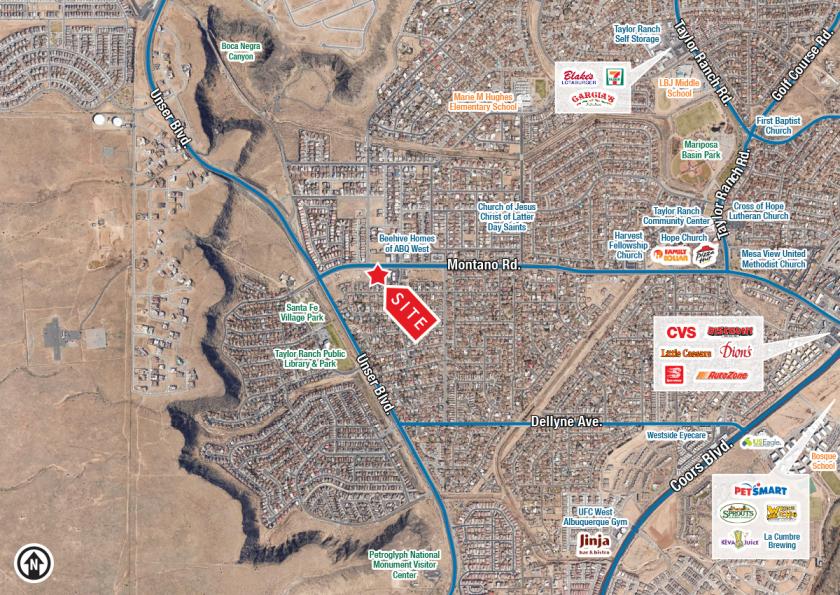
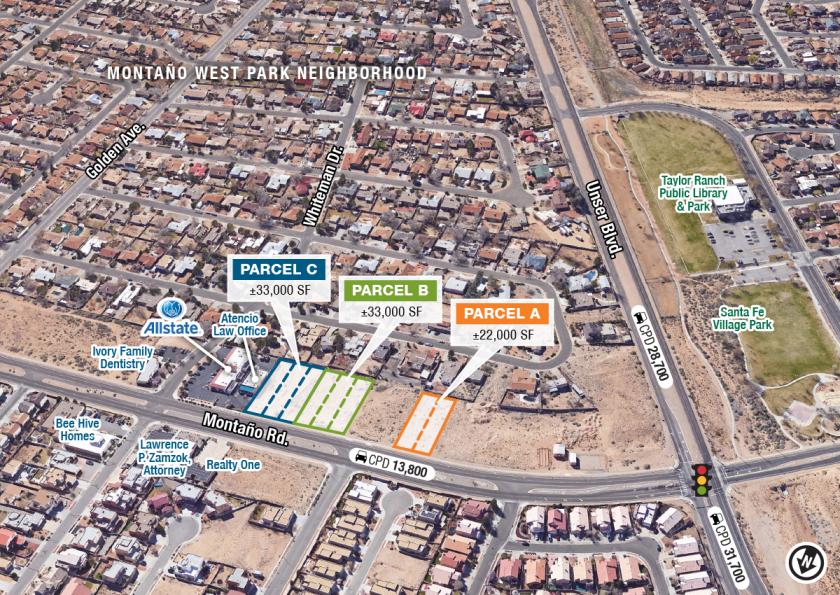
1-Mile | 3-Miles | 5-Miles | ||
---|---|---|---|---|
Total Population | 10,769 | 56,370 | 172,320 | |
Population Median Age | 40 | 39 | 38 | |
Population by Age | 0-9 Yrs | 1157 (10%) | 6409 (11%) | 20611 (11%) |
10-19 Yrs | 1564 (14%) | 7247 (12%) | 23715 (13%) | |
20-29 Yrs | 988 (9%) | 7156 (12%) | 22918 (13%) | |
30-39 Yrs | 1737 (16%) | 8543 (15%) | 25599 (14%) | |
40-49 Yrs | 1332 (12%) | 6748 (11%) | 21171 (12%) | |
50-59 Yrs | 1478 (13%) | 7441 (13%) | 21579 (12%) | |
60-69 Yrs | 1387 (12%) | 7246 (12%) | 20111 (11%) | |
70+ Yrs | 1125 (10%) | 5579 (9%) | 16617 (9%) | |
Median HH Income | $76,036 | $69,549 | $63,754 | |
Total Household Income | < 24K | 404 (10%) | 3319 (15%) | 12472 (18%) |
25-49K | 767 (19%) | 4099 (18%) | 12894 (19%) | |
50-74K | 786 (19%) | 4566 (20%) | 12992 (19%) | |
75-99K | 864 (21%) | 3520 (15%) | 9656 (14%) | |
100-199K | 1022 (25%) | 5350 (24%) | 14895 (22%) | |
200K+ | 143 (3%) | 1210 (5%) | 3171 (4%) | |
Highest Education Level | No Diploma | 334 | 2191 | 9585 |
Diploma or GED | 1843 | 8307 | 27170 | |
Some College | 2145 | 10222 | 28915 | |
Assoc. Degree | 823 | 4102 | 11444 | |
Bachelors Degree | 1420 | 8270 | 22847 | |
Higher Degree | 1075 | 6390 | 17108 | |
Total Housing Units | 4,106 | 23,415 | 70,635 | |
--Owner-Occupied | 3,398 | 16,108 | 45,344 | |
--Renter-Occupied | 590 | 5,955 | 20,736 | |
Owner-Occupied Values | < 100K | 92 | 585 | 2666 |
100-199K | 1847 | 6705 | 19227 | |
200-299K | 1136 | 5810 | 14851 | |
300-399K | 234 | 1725 | 4738 | |
400-499K | 58 | 654 | 1848 | |
500K+ | 30 | 629 | 2015 | |
Total Working Age Population | 8,555 | 45,563 | 136,939 | |
In Work Force | 5,686 | 29,685 | 88,134 | |
Not In Work Force | 2,869 | 15,878 | 48,805 | |
Workforce Employed | 5,262 | 27,863 | 82,754 | |
Workforce Unemployed | 382 | 1,630 | 4,955 | |
Civlian Workforce | 5,644 | 29,494 | 87,709 | |
Military Workforce | 42 | 191 | 425 | |
Total Households | 3,988 | 22,063 | 66,080 | |
Family Households | 2,856 | 14,521 | 41,998 | |
Non-Family Households | 1,131 | 7,542 | 24,082 | |
Married Couple | 2,000 | 10,308 | 28,908 | |
Other Family | 856 | 4,213 | 13,091 | |
Married w/Child | 740 | 3,605 | 11,361 | |
Single Male w/Child | 192 | 557 | 1,504 | |
Single Female w/Child | 263 | 1,626 | 5,113 |
Population Change Last Two Decades - Plus Projection
2000 | % | 2010 | % | 2020 | % | 2030 | |
---|---|---|---|---|---|---|---|
New Mexico | 1,819,046 | +13 | 2,059,179 | +6 | 2,187,183 | +6 | 2,308,475 |
Bernalillo County | 556,678 | +19 | 662,564 | +8 | 715,115 | +7 | 763,571 |
Sandoval County | 89,908 | +46 | 131,561 | +13 | 148,708 | +21 | 180,269 |
Total Working Age Population:
Total Households:
Total Working Age Population:
Total Households:
Total Working Age Population:
Total Households: