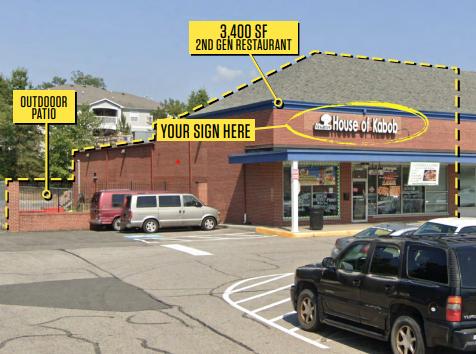
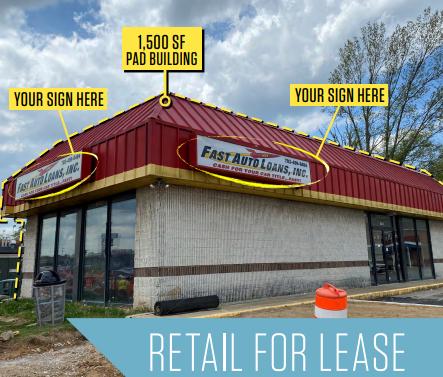
1-Mile | 3-Miles | 5-Miles | ||
---|---|---|---|---|
Total Population | 19,103 | 98,083 | 215,547 | |
Population Median Age | 34 | 35 | 36 | |
Population by Age | 0-9 Yrs | 3012 (15%) | 15302 (15%) | 32086 (14%) |
10-19 Yrs | 2197 (11%) | 11789 (12%) | 29336 (13%) | |
20-29 Yrs | 3332 (17%) | 14254 (14%) | 27796 (12%) | |
30-39 Yrs | 3044 (15%) | 16427 (16%) | 33849 (15%) | |
40-49 Yrs | 2898 (15%) | 13951 (14%) | 30691 (14%) | |
50-59 Yrs | 2306 (12%) | 12959 (13%) | 28528 (13%) | |
60-69 Yrs | 1380 (7%) | 8475 (8%) | 20032 (9%) | |
70+ Yrs | 934 (4%) | 4925 (5%) | 13229 (6%) | |
Median HH Income | $64,088 | $88,373 | $97,011 | |
Total Household Income | < 24K | 606 (9%) | 2914 (9%) | 5691 (8%) |
25-49K | 1816 (29%) | 5492 (17%) | 9663 (13%) | |
50-74K | 1076 (17%) | 5197 (16%) | 10244 (14%) | |
75-99K | 726 (11%) | 4619 (14%) | 10420 (14%) | |
100-199K | 1695 (27%) | 11029 (34%) | 24998 (35%) | |
200K+ | 218 (3%) | 2897 (9%) | 8531 (12%) | |
Highest Education Level | No Diploma | 2801 | 10404 | 19004 |
Diploma or GED | 3467 | 14404 | 28726 | |
Some College | 2089 | 12450 | 28062 | |
Assoc. Degree | 811 | 4695 | 11088 | |
Bachelors Degree | 2206 | 13603 | 31236 | |
Higher Degree | 1025 | 9297 | 23267 | |
Total Housing Units | 6,671 | 34,318 | 73,665 | |
--Owner-Occupied | 3,525 | 20,407 | 48,568 | |
--Renter-Occupied | 2,611 | 11,742 | 20,979 | |
Owner-Occupied Values | < 100K | 260 | 743 | 1379 |
100-199K | 410 | 1770 | 3188 | |
200-299K | 1484 | 6977 | 14818 | |
300-399K | 1186 | 6357 | 13903 | |
400-499K | 127 | 2395 | 7924 | |
500K+ | 58 | 2166 | 7357 | |
Total Working Age Population | 14,794 | 75,941 | 165,721 | |
In Work Force | 10,964 | 56,330 | 119,773 | |
Not In Work Force | 3,829 | 19,612 | 45,947 | |
Workforce Employed | 10,157 | 52,411 | 111,465 | |
Workforce Unemployed | 655 | 2,957 | 5,976 | |
Civlian Workforce | 10,812 | 55,367 | 117,441 | |
Military Workforce | 152 | 962 | 2,332 | |
Total Households | 6,136 | 32,149 | 69,547 | |
Family Households | 4,192 | 22,097 | 50,366 | |
Non-Family Households | 1,944 | 10,052 | 19,180 | |
Married Couple | 3,002 | 16,495 | 37,895 | |
Other Family | 1,190 | 5,602 | 12,472 | |
Married w/Child | 1,625 | 8,507 | 18,914 | |
Single Male w/Child | 122 | 734 | 1,790 | |
Single Female w/Child | 387 | 1,800 | 4,407 |
Population Change Last Two Decades - Plus Projection
2000 | % | 2010 | % | 2020 | % | 2030 | |
---|---|---|---|---|---|---|---|
Maryland | 5,296,486 | +9 | 5,773,552 | +6 | 6,141,900 | +6 | 6,518,750 |
Charles County | 120,546 | +22 | 146,551 | +14 | 167,050 | +17 | 194,650 |
Virginia | 7,078,515 | +13 | 8,001,024 | +8 | 8,655,021 | +8 | 9,331,666 |
Fairfax County | 969,749 | +12 | 1,081,726 | +7 | 1,162,504 | +7 | 1,244,025 |
Prince William County | 280,813 | +43 | 402,002 | +19 | 478,134 | +20 | 571,844 |
Stafford County | 92,446 | +39 | 128,961 | +19 | 154,093 | +19 | 183,161 |
Total Working Age Population:
Total Households:
Total Working Age Population:
Total Households:
Total Working Age Population:
Total Households: