Industrial Properties
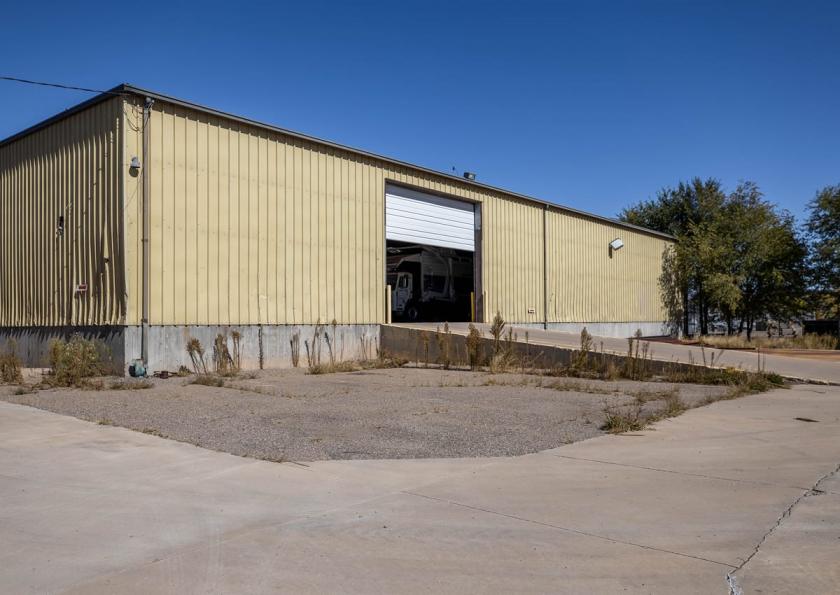
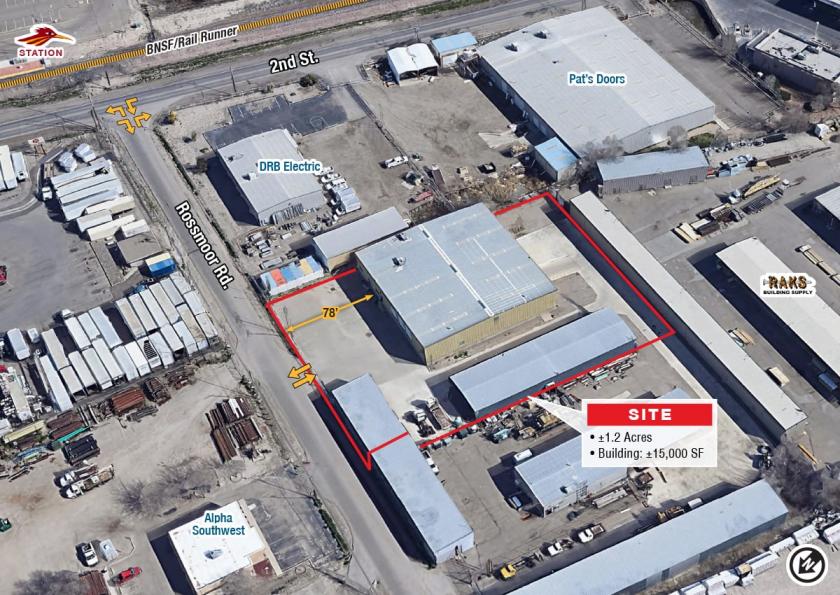
204 Rossmoor Road Southwest Albuquerque, NM 87105
204 Rossmoor Road Southwest Albuquerque, NM 87105
Details & Description
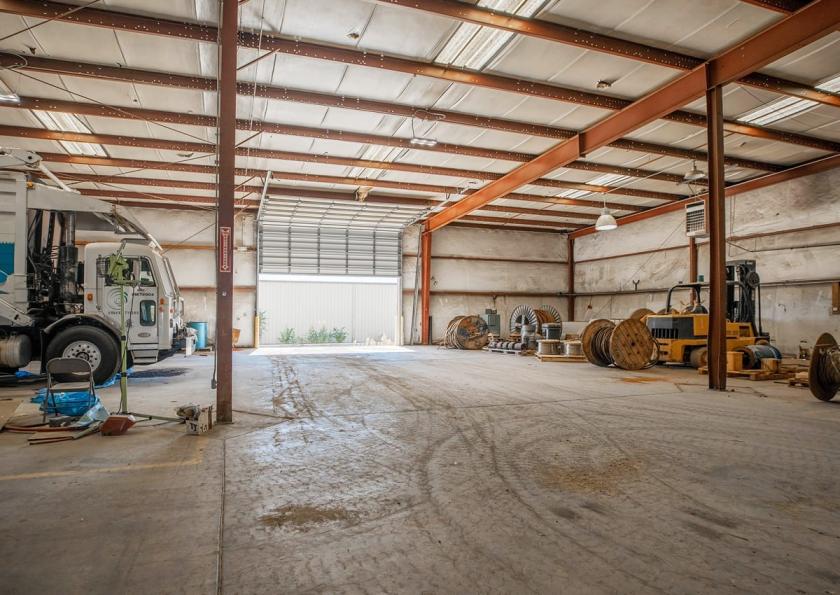
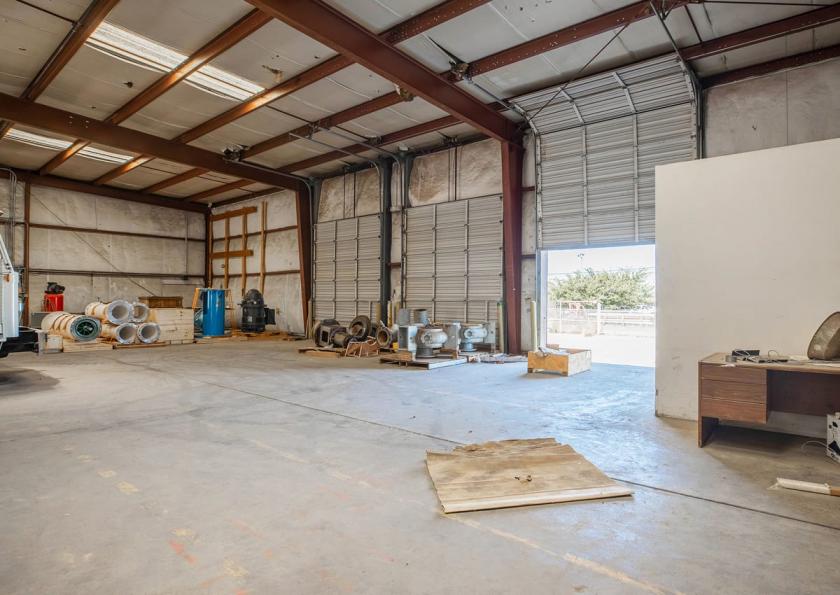
Additional Photos
Listing Agents

Riley McKee
O: 505-998-1656
M: 505-379-1549
riley@sunvista.com
O: 505-998-1656
M: 505-379-1549
riley@sunvista.com

Alexandra Pulliam
O: 505-338-9875
M: 505-350-5729
alex@sunvista.com
O: 505-338-9875
M: 505-350-5729
alex@sunvista.com
While we strive to provide the most accurate information, all listing information, and demographic data, is provided by third-parties. As such, MyEListing will not be responsible for the accuracy of the information. It is strongly recommended that you verify all information with the listing agent, and any relevant agencies, prior to making any decisions.