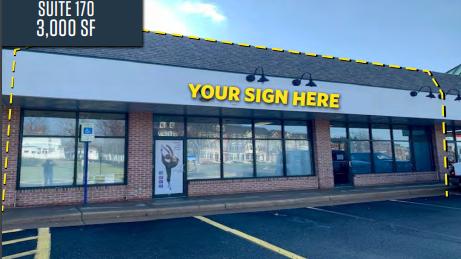
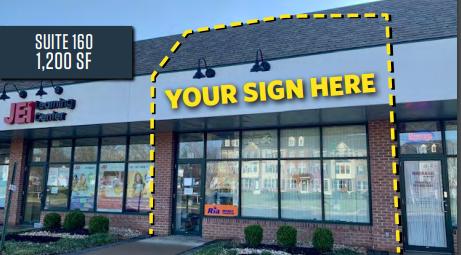
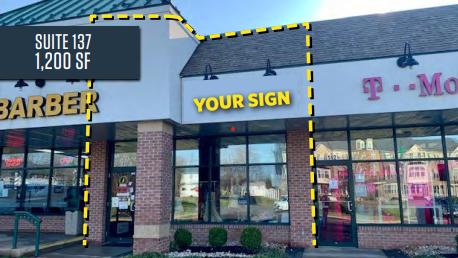
1-Mile | 3-Miles | 5-Miles | ||
---|---|---|---|---|
Total Population | 15,294 | 80,069 | 165,211 | |
Population Median Age | 36 | 37 | 35 | |
Population by Age | 0-9 Yrs | 2151 (14%) | 10855 (13%) | 24134 (14%) |
10-19 Yrs | 2483 (16%) | 12242 (15%) | 25760 (15%) | |
20-29 Yrs | 1755 (11%) | 8444 (10%) | 17016 (10%) | |
30-39 Yrs | 1991 (13%) | 11834 (14%) | 25446 (15%) | |
40-49 Yrs | 2293 (14%) | 12992 (16%) | 29272 (17%) | |
50-59 Yrs | 2420 (15%) | 11416 (14%) | 22150 (13%) | |
60-69 Yrs | 1162 (7%) | 5539 (6%) | 11282 (6%) | |
70+ Yrs | 1039 (6%) | 6747 (8%) | 10151 (6%) | |
Median HH Income | $142,816 | $136,519 | $140,741 | |
Total Household Income | < 24K | 217 (4%) | 1405 (4%) | 2543 (4%) |
25-49K | 280 (5%) | 2339 (8%) | 4407 (7%) | |
50-74K | 640 (12%) | 3215 (11%) | 5875 (10%) | |
75-99K | 526 (10%) | 3054 (10%) | 5549 (9%) | |
100-199K | 1953 (37%) | 10227 (36%) | 21007 (37%) | |
200K+ | 1553 (30%) | 8078 (28%) | 16427 (29%) | |
Highest Education Level | No Diploma | 312 | 1969 | 5244 |
Diploma or GED | 941 | 5309 | 11407 | |
Some College | 1444 | 7946 | 15212 | |
Assoc. Degree | 752 | 3393 | 6474 | |
Bachelors Degree | 3613 | 19711 | 40019 | |
Higher Degree | 2743 | 14425 | 28390 | |
Total Housing Units | 5,349 | 29,337 | 57,607 | |
--Owner-Occupied | 4,271 | 20,319 | 40,914 | |
--Renter-Occupied | 897 | 8,000 | 14,893 | |
Owner-Occupied Values | < 100K | 52 | 282 | 688 |
100-199K | 95 | 529 | 1119 | |
200-299K | 417 | 1468 | 2988 | |
300-399K | 965 | 3787 | 7572 | |
400-499K | 662 | 3609 | 7204 | |
500K+ | 2080 | 10644 | 21343 | |
Total Working Age Population | 11,634 | 61,122 | 124,011 | |
In Work Force | 8,608 | 44,924 | 93,529 | |
Not In Work Force | 3,026 | 16,198 | 30,482 | |
Workforce Employed | 8,302 | 43,386 | 90,340 | |
Workforce Unemployed | 260 | 1,239 | 2,580 | |
Civlian Workforce | 8,563 | 44,625 | 92,920 | |
Military Workforce | 45 | 299 | 609 | |
Total Households | 5,168 | 28,319 | 55,807 | |
Family Households | 3,790 | 20,190 | 41,878 | |
Non-Family Households | 1,378 | 8,129 | 13,929 | |
Married Couple | 3,181 | 17,197 | 35,489 | |
Other Family | 609 | 2,993 | 6,389 | |
Married w/Child | 1,745 | 9,681 | 20,771 | |
Single Male w/Child | 81 | 453 | 959 | |
Single Female w/Child | 289 | 1,371 | 2,780 |
Population Change Last Two Decades - Plus Projection
2000 | % | 2010 | % | 2020 | % | 2030 | |
---|---|---|---|---|---|---|---|
Maryland | 5,296,486 | +9 | 5,773,552 | +6 | 6,141,900 | +6 | 6,518,750 |
Montgomery County | 873,341 | +11 | 971,777 | +8 | 1,052,050 | +7 | 1,128,800 |
Virginia | 7,078,515 | +13 | 8,001,024 | +8 | 8,655,021 | +8 | 9,331,666 |
Fairfax County | 969,749 | +12 | 1,081,726 | +7 | 1,162,504 | +7 | 1,244,025 |
Fauquier County | 55,139 | +18 | 65,203 | +9 | 71,395 | +10 | 78,698 |
Loudoun County | 169,599 | +84 | 312,311 | +38 | 430,584 | +29 | 554,808 |
Total Working Age Population:
Total Households:
Total Working Age Population:
Total Households:
Total Working Age Population:
Total Households: