Office Space
2330 West Joppa Road LuthervilleTimonium, MD 21093
2330 West Joppa Road LuthervilleTimonium, MD 21093

Details & Description
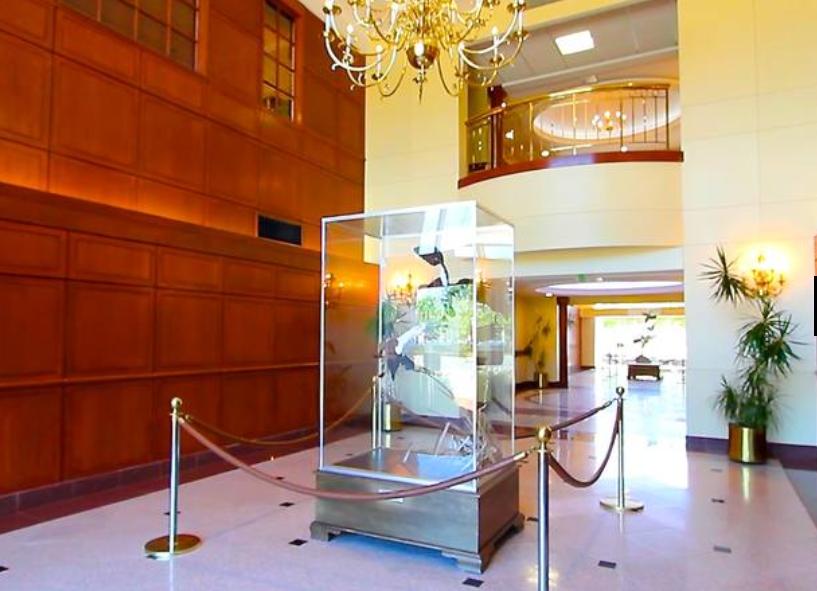
Additional Photos


Listing Agents

Jesse Schwartzman
O: 443-632-2067
M: 410-852-4106
jschwartzman@klnb.com
O: 443-632-2067
M: 410-852-4106
jschwartzman@klnb.com
While we strive to provide the most accurate information, all listing information, and demographic data, is provided by third-parties. As such, MyEListing will not be responsible for the accuracy of the information. It is strongly recommended that you verify all information with the listing agent, and any relevant agencies, prior to making any decisions.


