Health Care and Medical Properties
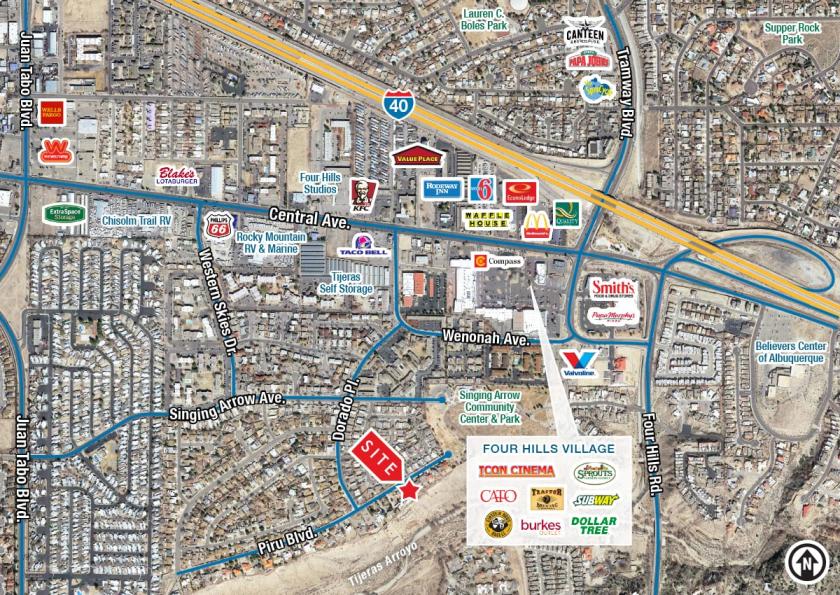
12904 Piru Boulevard Southeast Albuquerque, NM 87123
12904 Piru Boulevard Southeast Albuquerque, NM 87123

Details & Description
Additional Photos


Listing Agents

Martha Carpenter
O: 505-338-9870
M: 505-228-0154
martha@sunvista.com
O: 505-338-9870
M: 505-228-0154
martha@sunvista.com
While we strive to provide the most accurate information, all listing information, and demographic data, is provided by third-parties. As such, MyEListing will not be responsible for the accuracy of the information. It is strongly recommended that you verify all information with the listing agent, and any relevant agencies, prior to making any decisions.


