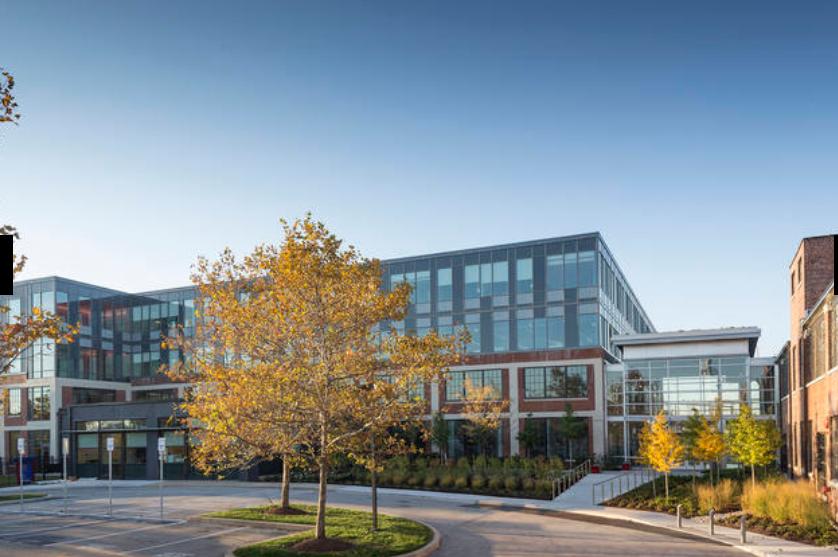
NAIOP award winning development
Strong millennial workforce
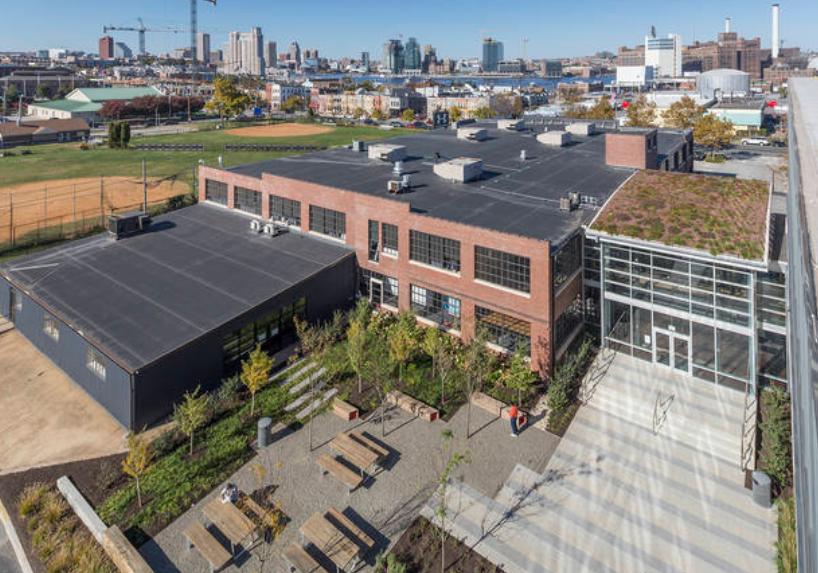
Immediate access to I-95
3 parking garages with 1,500 free spaces
110,000 SF retail shopping
473 apartment units
Diamondback Brewing Company
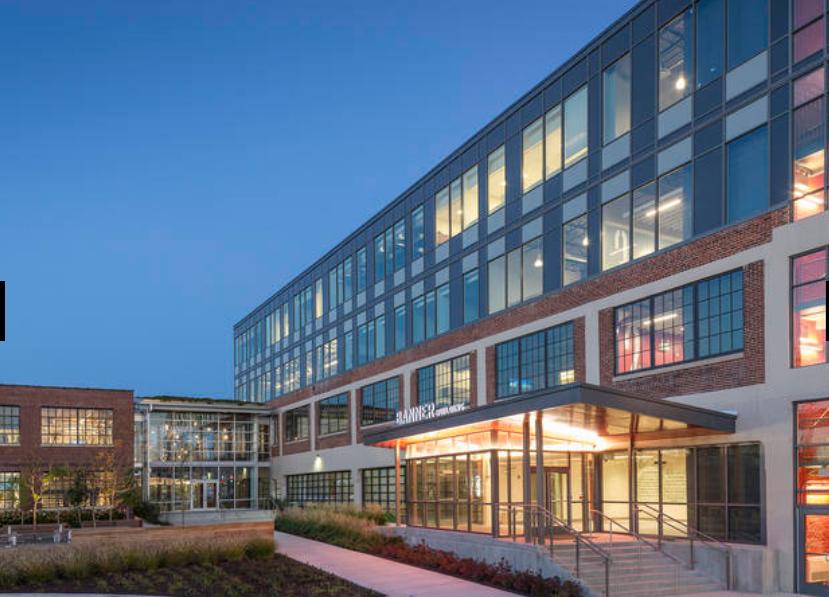
400,000 SF of existing offices
Marriott Courtyard Hotel under construction (126 rooms)
Retail tenants include: Harris Teeter, Iron Rooster, Samos, Dunkin Donuts, M&T Banks, PNC and others
1215 E. Fort Avenue:
1st Floor: 5,368 SF
Fully furnished first floor
Shared tenant conference center
Full Service (Net of Util.) leases
No part of this information may be copied, reproduced, repurposed, or screen-captured for any commercial purpose without prior written authorization from MyEListing.
While we strive to provide the most accurate information, all listing information, and demographic data, is provided by third-parties. As such, MyEListing will not be responsible for the accuracy of the information. It is strongly recommended that you verify all information with the listing agent, and any relevant agencies, prior to making any decisions.
What is the building size of this commercial Office property?
The size of this lease property at '.1215 East Fort Avenue.' is 5368 square feet
What kind of Office is the propery at 1215 East Fort Avenue?
The property at 1215 East Fort Avenue Baltimore, MD 21230 is listed as a Professional Office property
What is the population within 1 mile of 1215 East Fort Avenue in Baltimore?
The population within 1 mile of 1215 East Fort Avenue Baltimore, MD 21230 is 23,312 people.
Who do I contact for questions about 1215 East Fort Avenue?
You should contact the listing agent,
Joseph Nolan, for any details regarding this commercial listing.