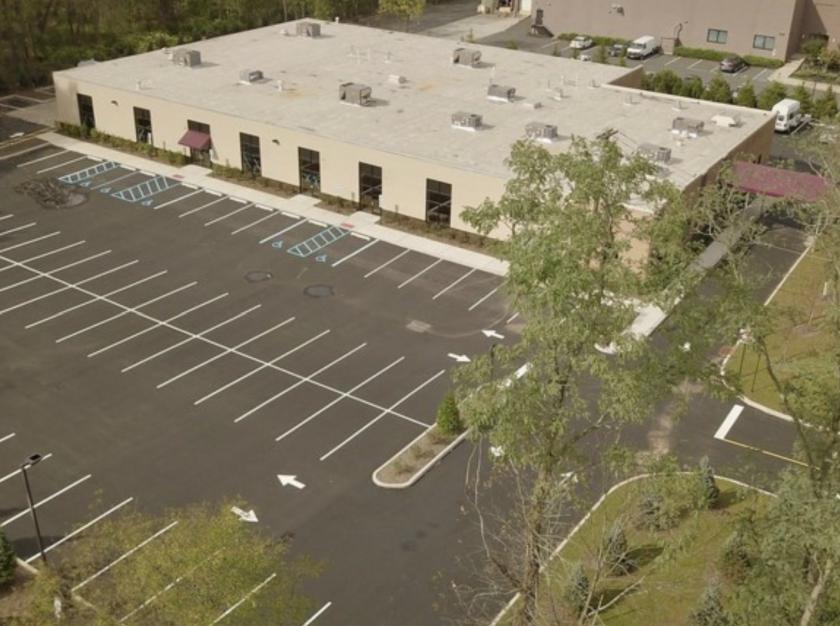
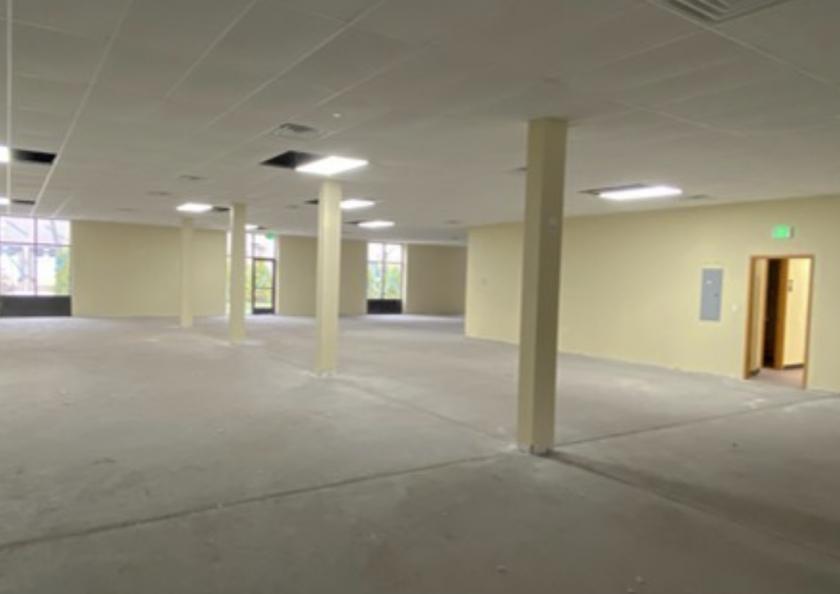
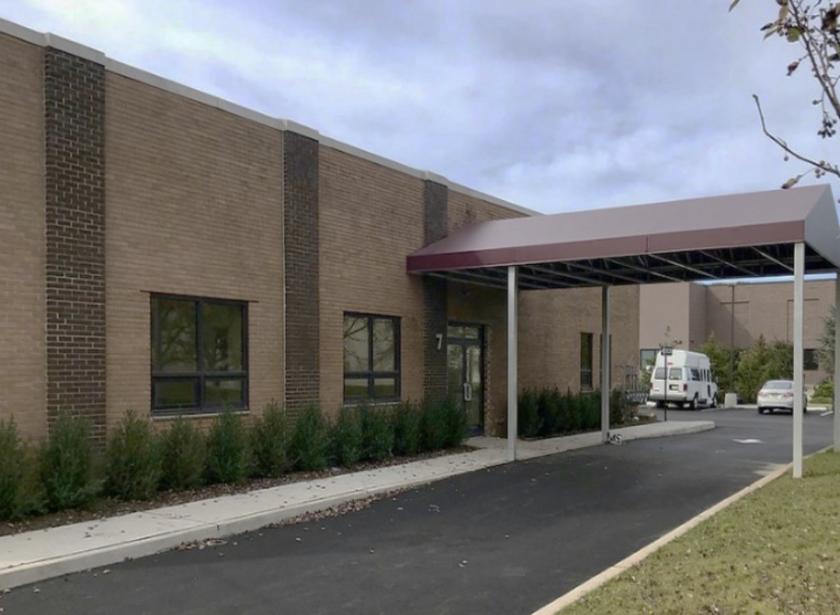
1-Mile | 3-Miles | 5-Miles | ||
---|---|---|---|---|
Total Population | 10,981 | 103,894 | 366,931 | |
Population Median Age | 40 | 41 | 39 | |
Population by Age | 0-9 Yrs | 1427 (12%) | 11856 (11%) | 46724 (12%) |
10-19 Yrs | 1308 (11%) | 12368 (11%) | 42308 (11%) | |
20-29 Yrs | 873 (7%) | 10359 (9%) | 41428 (11%) | |
30-39 Yrs | 1557 (14%) | 12815 (12%) | 53559 (14%) | |
40-49 Yrs | 1648 (15%) | 14782 (14%) | 51101 (13%) | |
50-59 Yrs | 1570 (14%) | 15992 (15%) | 53365 (14%) | |
60-69 Yrs | 1407 (12%) | 13164 (12%) | 41379 (11%) | |
70+ Yrs | 1191 (10%) | 12557 (12%) | 37068 (10%) | |
Median HH Income | $138,283 | $118,093 | $98,172 | |
Total Household Income | < 24K | 474 (12%) | 3295 (9%) | 14425 (11%) |
25-49K | 292 (7%) | 3623 (10%) | 16542 (12%) | |
50-74K | 265 (7%) | 4069 (11%) | 17556 (13%) | |
75-99K | 389 (10%) | 3832 (10%) | 16304 (12%) | |
100-199K | 1247 (33%) | 12430 (35%) | 40876 (32%) | |
200K+ | 1062 (28%) | 7956 (22%) | 21569 (16%) | |
Highest Education Level | No Diploma | 443 | 6023 | 24902 |
Diploma or GED | 1046 | 15230 | 65277 | |
Some College | 714 | 9580 | 36597 | |
Assoc. Degree | 271 | 4039 | 14836 | |
Bachelors Degree | 2622 | 21709 | 67882 | |
Higher Degree | 2684 | 18342 | 50104 | |
Total Housing Units | 3,890 | 36,495 | 133,909 | |
--Owner-Occupied | 3,020 | 28,094 | 86,330 | |
--Renter-Occupied | 709 | 7,111 | 40,942 | |
Owner-Occupied Values | < 100K | 20 | 286 | 1902 |
100-199K | 47 | 743 | 5201 | |
200-299K | 75 | 3630 | 18012 | |
300-399K | 723 | 7386 | 23573 | |
400-499K | 804 | 5285 | 13886 | |
500K+ | 1350 | 10763 | 23756 | |
Total Working Age Population | 8,677 | 84,228 | 293,982 | |
In Work Force | 5,497 | 55,833 | 198,150 | |
Not In Work Force | 3,180 | 28,395 | 95,832 | |
Workforce Employed | 5,144 | 52,843 | 187,854 | |
Workforce Unemployed | 352 | 2,990 | 10,223 | |
Civlian Workforce | 5,497 | 55,833 | 198,077 | |
Military Workforce | 0 | 0 | 73 | |
Total Households | 3,729 | 35,204 | 127,272 | |
Family Households | 2,990 | 28,523 | 94,592 | |
Non-Family Households | 739 | 6,681 | 32,680 | |
Married Couple | 2,600 | 23,446 | 73,760 | |
Other Family | 390 | 5,076 | 20,831 | |
Married w/Child | 1,354 | 10,610 | 34,572 | |
Single Male w/Child | 21 | 569 | 2,597 | |
Single Female w/Child | 118 | 1,103 | 5,471 |
Population Change Last Two Decades - Plus Projection
2000 | % | 2010 | % | 2020 | % | 2030 | |
---|---|---|---|---|---|---|---|
New Jersey | 8,414,350 | +4 | 8,791,894 | +4 | 9,132,700 | +4 | 9,530,900 |
Middlesex County | 750,162 | +8 | 809,858 | +8 | 873,400 | +7 | 932,200 |
Morris County | 470,212 | +5 | 492,276 | +3 | 509,100 | +5 | 535,600 |
Somerset County | 297,490 | +9 | 323,444 | +6 | 342,900 | +7 | 366,700 |
Union County | 522,541 | +3 | 536,499 | +7 | 573,000 | +6 | 605,600 |
Total Working Age Population:
Total Households:
Total Working Age Population:
Total Households:
Total Working Age Population:
Total Households: