Industrial Properties
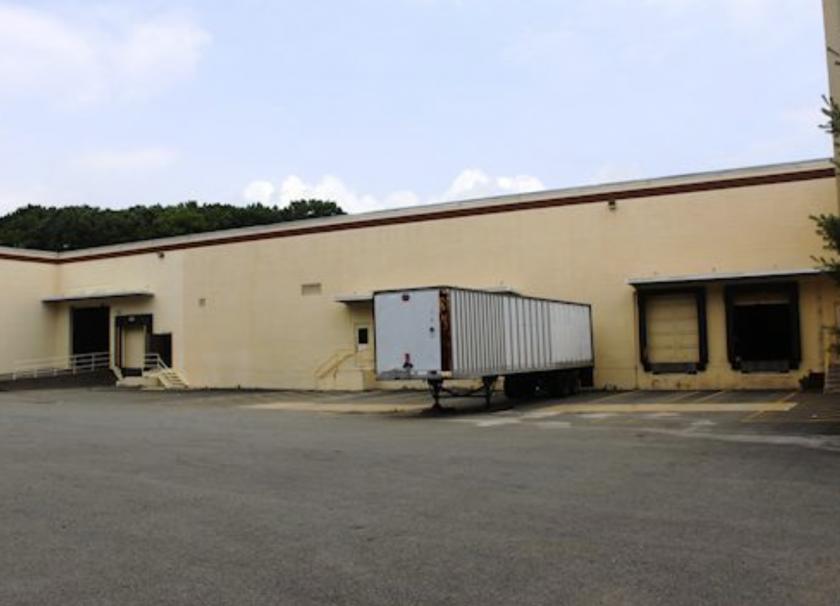
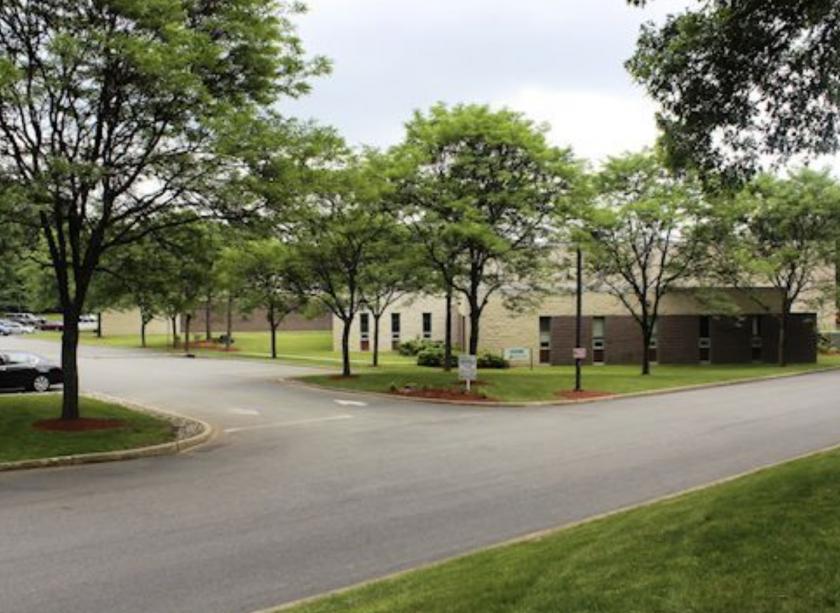
181 East Halsey Road ParsippanyTroy Hills, NJ 07054
181 East Halsey Road ParsippanyTroy Hills, NJ 07054
Details & Description
Listing Agents

Christopher Galiano
O: 732-985-3009
M: 732-887-8138
cgaliano@naidb.com
O: 732-985-3009
M: 732-887-8138
cgaliano@naidb.com
While we strive to provide the most accurate information, all listing information, and demographic data, is provided by third-parties. As such, MyEListing will not be responsible for the accuracy of the information. It is strongly recommended that you verify all information with the listing agent, and any relevant agencies, prior to making any decisions.