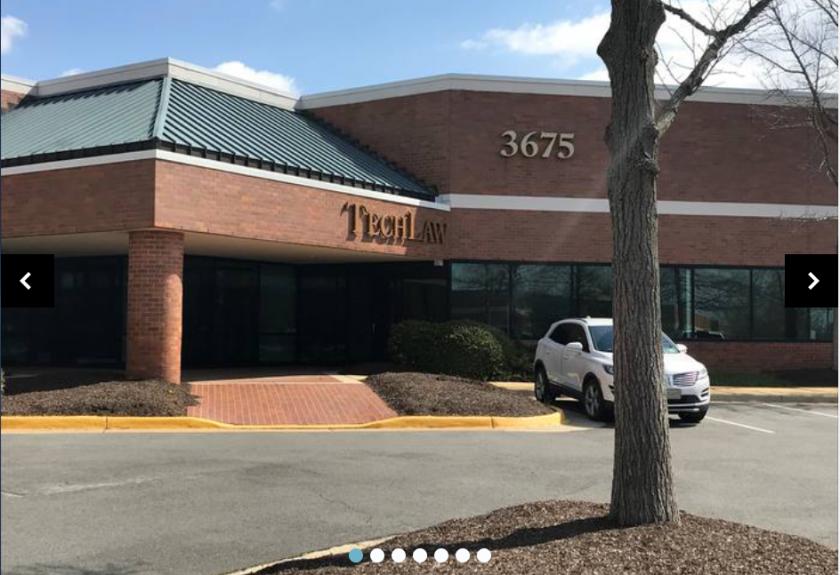
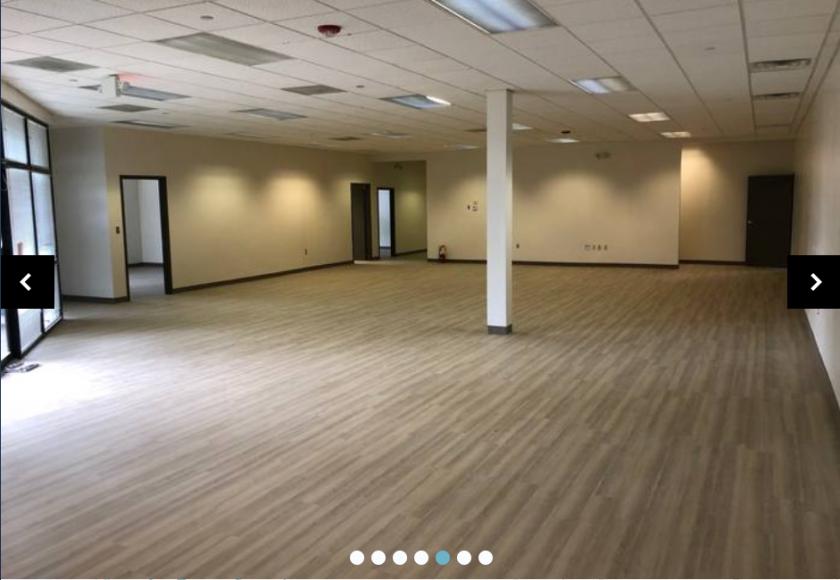
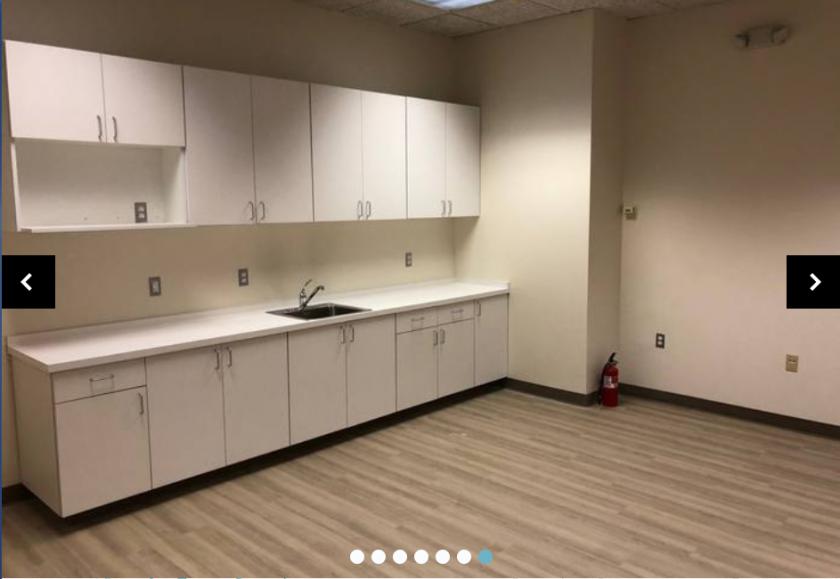
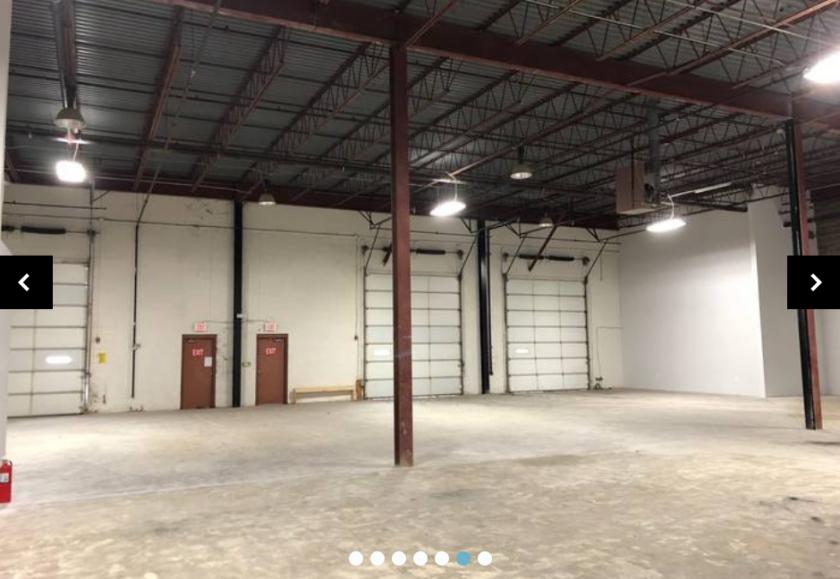
Flex-Office-Warehouse
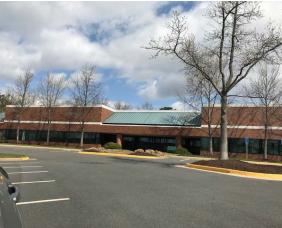
3675 Concorde Parkway Chantilly, VA 20151
3675 Concorde Parkway Chantilly, VA 20151
Details & Description
Additional Photos
Listing Agents

Chase Stewart
O: 703-268-2732
M: 703-489-5649
cstewart@klnb.com
O: 703-268-2732
M: 703-489-5649
cstewart@klnb.com

Marc Tasker
O: 703-268-2735
M: 703-932-2073
mtasker@klnb.com
O: 703-268-2735
M: 703-932-2073
mtasker@klnb.com

Ryan Goeller
O: 703-268-2731
M: 571-278-8297
rgoeller@klnb.com
O: 703-268-2731
M: 571-278-8297
rgoeller@klnb.com
While we strive to provide the most accurate information, all listing information, and demographic data, is provided by third-parties. As such, MyEListing will not be responsible for the accuracy of the information. It is strongly recommended that you verify all information with the listing agent, and any relevant agencies, prior to making any decisions.


