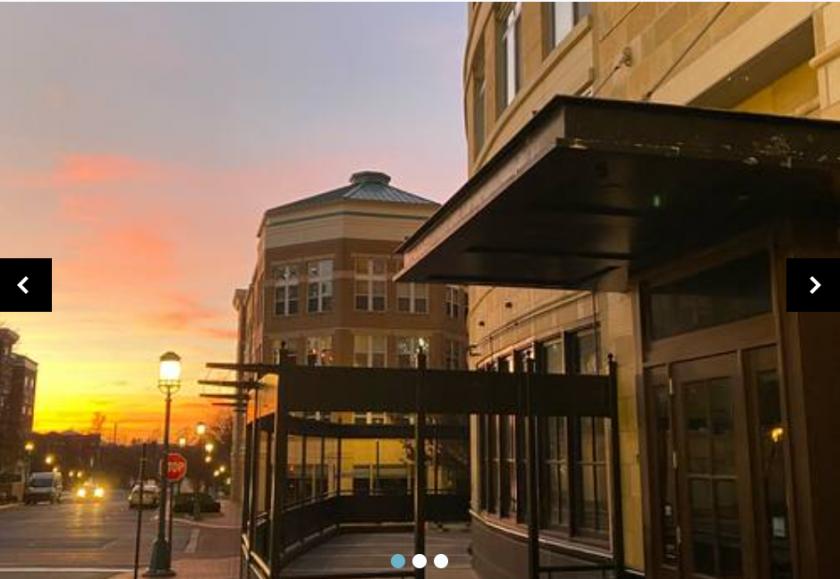
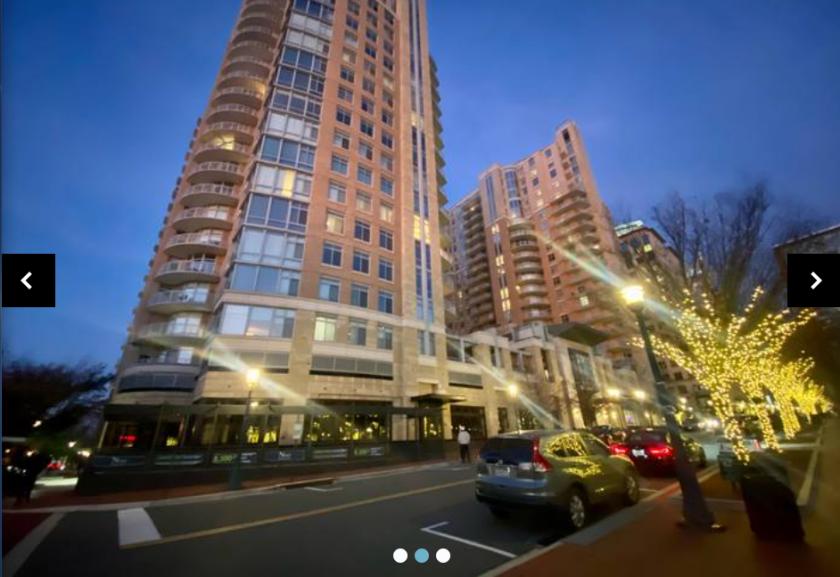
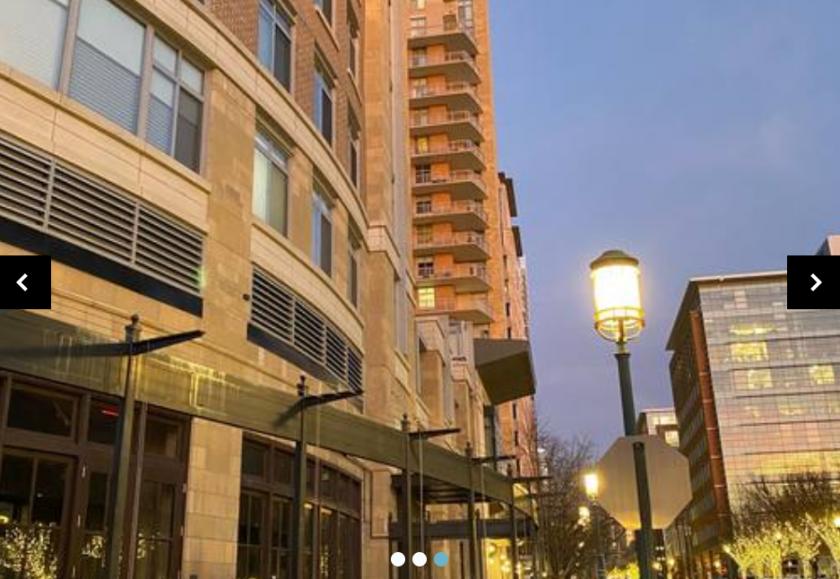
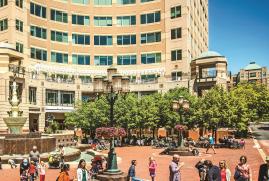
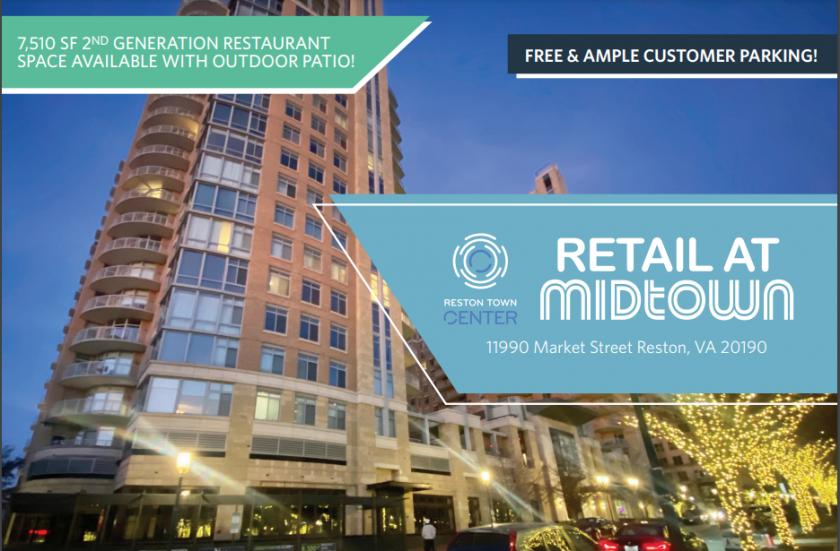
1-Mile | 3-Miles | 5-Miles | ||
---|---|---|---|---|
Total Population | 15,892 | 129,824 | 226,640 | |
Population Median Age | 40 | 37 | 38 | |
Population by Age | 0-9 Yrs | 1633 (10%) | 17688 (13%) | 30124 (13%) |
10-19 Yrs | 1080 (6%) | 14498 (11%) | 28653 (12%) | |
20-29 Yrs | 2606 (16%) | 17198 (13%) | 28253 (12%) | |
30-39 Yrs | 3040 (19%) | 20990 (16%) | 33410 (14%) | |
40-49 Yrs | 2082 (13%) | 18055 (13%) | 32196 (14%) | |
50-59 Yrs | 2043 (12%) | 18180 (14%) | 32995 (14%) | |
60-69 Yrs | 1822 (11%) | 13683 (10%) | 23996 (10%) | |
70+ Yrs | 1587 (9%) | 9531 (7%) | 17013 (7%) | |
Median HH Income | $122,564 | $123,861 | $133,865 | |
Total Household Income | < 24K | 549 (7%) | 3229 (6%) | 4671 (5%) |
25-49K | 708 (9%) | 4656 (9%) | 6938 (8%) | |
50-74K | 684 (9%) | 4770 (9%) | 7278 (9%) | |
75-99K | 985 (13%) | 6178 (12%) | 9228 (11%) | |
100-199K | 2944 (39%) | 18231 (37%) | 28542 (36%) | |
200K+ | 1644 (21%) | 11243 (23%) | 22280 (28%) | |
Highest Education Level | No Diploma | 630 | 6611 | 11570 |
Diploma or GED | 1105 | 10398 | 17736 | |
Some College | 1239 | 10196 | 17912 | |
Assoc. Degree | 432 | 4220 | 7635 | |
Bachelors Degree | 4776 | 30996 | 51702 | |
Higher Degree | 4049 | 27783 | 48248 | |
Total Housing Units | 8,227 | 50,590 | 82,268 | |
--Owner-Occupied | 3,219 | 29,619 | 53,843 | |
--Renter-Occupied | 4,294 | 18,688 | 25,094 | |
Owner-Occupied Values | < 100K | 12 | 294 | 581 |
100-199K | 109 | 839 | 1387 | |
200-299K | 175 | 3046 | 4390 | |
300-399K | 620 | 4423 | 7500 | |
400-499K | 833 | 6230 | 9218 | |
500K+ | 1468 | 14786 | 30768 | |
Total Working Age Population | 13,555 | 102,920 | 178,382 | |
In Work Force | 10,366 | 78,360 | 133,399 | |
Not In Work Force | 3,189 | 24,560 | 44,983 | |
Workforce Employed | 9,997 | 75,080 | 127,722 | |
Workforce Unemployed | 304 | 3,022 | 5,111 | |
Civlian Workforce | 10,301 | 78,102 | 132,833 | |
Military Workforce | 65 | 258 | 566 | |
Total Households | 7,513 | 48,307 | 78,938 | |
Family Households | 3,815 | 32,103 | 56,818 | |
Non-Family Households | 3,698 | 16,204 | 22,120 | |
Married Couple | 3,073 | 26,093 | 47,551 | |
Other Family | 742 | 6,010 | 9,267 | |
Married w/Child | 1,041 | 11,833 | 22,270 | |
Single Male w/Child | 131 | 860 | 1,311 | |
Single Female w/Child | 271 | 2,262 | 3,077 |
Population Change Last Two Decades - Plus Projection
2000 | % | 2010 | % | 2020 | % | 2030 | |
---|---|---|---|---|---|---|---|
Maryland | 5,296,486 | +9 | 5,773,552 | +6 | 6,141,900 | +6 | 6,518,750 |
Montgomery County | 873,341 | +11 | 971,777 | +8 | 1,052,050 | +7 | 1,128,800 |
Virginia | 7,078,515 | +13 | 8,001,024 | +8 | 8,655,021 | +8 | 9,331,666 |
Fairfax County | 969,749 | +12 | 1,081,726 | +7 | 1,162,504 | +7 | 1,244,025 |
Loudoun County | 169,599 | +84 | 312,311 | +38 | 430,584 | +29 | 554,808 |
Prince William County | 280,813 | +43 | 402,002 | +19 | 478,134 | +20 | 571,844 |
Total Working Age Population:
Total Households:
Total Working Age Population:
Total Households:
Total Working Age Population:
Total Households: