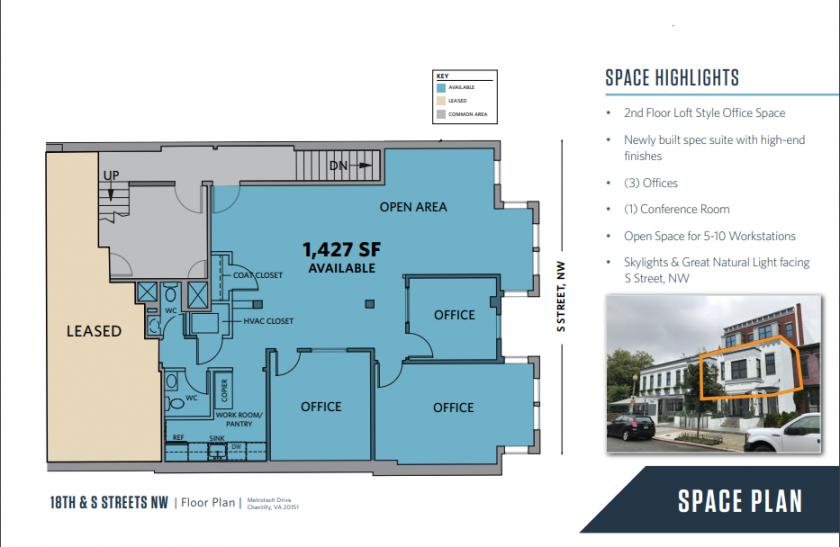
1-Mile | 3-Miles | 5-Miles | ||
---|---|---|---|---|
Total Population | 86,358 | 374,943 | 787,761 | |
Population Median Age | 37 | 37 | 37 | |
Population by Age | 0-9 Yrs | 5650 (6%) | 29871 (7%) | 80364 (10%) |
10-19 Yrs | 2806 (3%) | 27612 (7%) | 67077 (8%) | |
20-29 Yrs | 22764 (26%) | 95916 (25%) | 163021 (20%) | |
30-39 Yrs | 24928 (28%) | 88169 (23%) | 163704 (20%) | |
40-49 Yrs | 10467 (12%) | 42227 (11%) | 96439 (12%) | |
50-59 Yrs | 8195 (9%) | 35721 (9%) | 84380 (10%) | |
60-69 Yrs | 6279 (7%) | 29027 (7%) | 67867 (8%) | |
70+ Yrs | 5270 (6%) | 26400 (7%) | 64908 (8%) | |
Median HH Income | $112,114 | $108,274 | $104,767 | |
Total Household Income | < 24K | 5447 (11%) | 22723 (13%) | 46897 (13%) |
25-49K | 4792 (10%) | 16819 (9%) | 37732 (11%) | |
50-74K | 5137 (10%) | 19749 (11%) | 40174 (11%) | |
75-99K | 5307 (11%) | 19242 (11%) | 37617 (11%) | |
100-199K | 15992 (34%) | 53074 (31%) | 102526 (30%) | |
200K+ | 10336 (21%) | 37791 (22%) | 73417 (21%) | |
Highest Education Level | No Diploma | 3796 | 18869 | 44335 |
Diploma or GED | 4147 | 23885 | 67539 | |
Some College | 3993 | 22088 | 56852 | |
Assoc. Degree | 763 | 5678 | 15497 | |
Bachelors Degree | 23449 | 86088 | 167008 | |
Higher Degree | 35721 | 123233 | 226593 | |
Total Housing Units | 51,753 | 187,655 | 371,210 | |
--Owner-Occupied | 16,253 | 66,497 | 143,237 | |
--Renter-Occupied | 30,758 | 102,901 | 195,126 | |
Owner-Occupied Values | < 100K | 295 | 978 | 2142 |
100-199K | 315 | 868 | 2488 | |
200-299K | 912 | 4164 | 9922 | |
300-399K | 2235 | 7343 | 16399 | |
400-499K | 2004 | 7658 | 16507 | |
500K+ | 10493 | 45486 | 95780 | |
Total Working Age Population | 79,117 | 334,382 | 673,236 | |
In Work Force | 64,802 | 253,705 | 494,822 | |
Not In Work Force | 14,314 | 80,677 | 178,414 | |
Workforce Employed | 62,592 | 241,572 | 465,654 | |
Workforce Unemployed | 2,035 | 10,703 | 23,631 | |
Civlian Workforce | 64,627 | 252,275 | 489,285 | |
Military Workforce | 175 | 1,430 | 5,537 | |
Total Households | 47,011 | 169,398 | 338,363 | |
Family Households | 12,496 | 57,987 | 143,114 | |
Non-Family Households | 34,515 | 111,411 | 195,249 | |
Married Couple | 10,360 | 43,382 | 102,845 | |
Other Family | 2,136 | 14,605 | 40,269 | |
Married w/Child | 2,890 | 14,104 | 40,283 | |
Single Male w/Child | 172 | 1,581 | 4,200 | |
Single Female w/Child | 655 | 4,889 | 13,400 |
Population Change Last Two Decades - Plus Projection
2000 | % | 2010 | % | 2020 | % | 2030 | |
---|---|---|---|---|---|---|---|
District of Columbia | 572,059 | +5 | 601,723 | +21 | 729,501 | +15 | 842,154 |
Maryland | 5,296,486 | +9 | 5,773,552 | +6 | 6,141,900 | +6 | 6,518,750 |
Montgomery County | 873,341 | +11 | 971,777 | +8 | 1,052,050 | +7 | 1,128,800 |
Prince Georges County | 801,515 | +8 | 863,420 | +6 | 916,150 | +4 | 952,950 |
Virginia | 7,078,515 | +13 | 8,001,024 | +8 | 8,655,021 | +8 | 9,331,666 |
Arlington County | 189,453 | +10 | 207,627 | +20 | 249,298 | +10 | 274,339 |
Fairfax County | 969,749 | +12 | 1,081,726 | +7 | 1,162,504 | +7 | 1,244,025 |
Alexandria city | 128,283 | +9 | 139,966 | +19 | 166,261 | +10 | 182,067 |
Total Working Age Population:
Total Households:
Total Working Age Population:
Total Households:
Total Working Age Population:
Total Households: