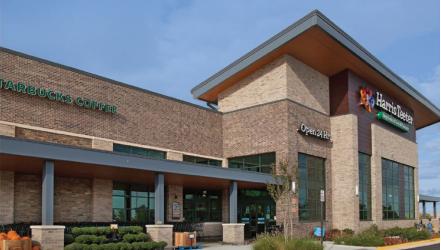
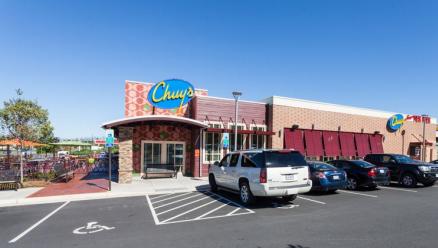
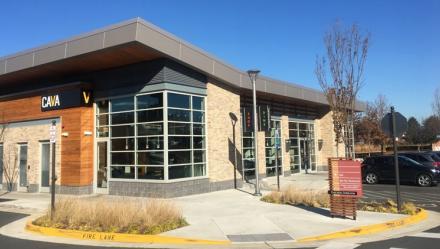
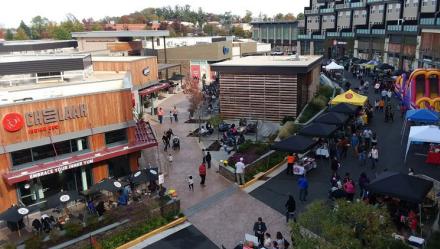
Retail Space
21475 Epicerie Plaza Sterling, VA 20164
21475 Epicerie Plaza Sterling, VA 20164
Details & Description
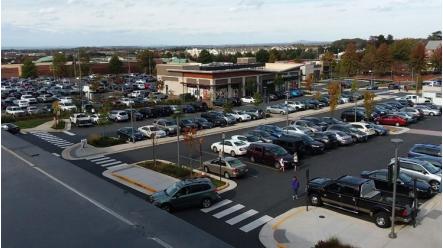
Additional Photos
Listing Agents

Forrest Morrill
O: 703-268-2707
fmorrill@klnb.com
O: 703-268-2707
fmorrill@klnb.com

Dallon L. Cheney
O: 703-268-2703
M: 703-850-8342
dcheney@klnb.com
O: 703-268-2703
M: 703-850-8342
dcheney@klnb.com
While we strive to provide the most accurate information, all listing information, and demographic data, is provided by third-parties. As such, MyEListing will not be responsible for the accuracy of the information. It is strongly recommended that you verify all information with the listing agent, and any relevant agencies, prior to making any decisions.


