Flex-Office-Warehouse
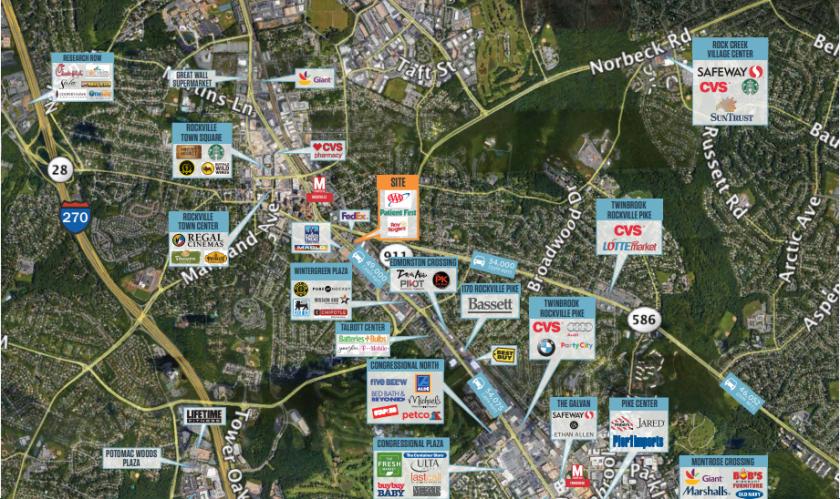
14150 Mariah Court Chantilly, VA 20151
14150 Mariah Court Chantilly, VA 20151
Details & Description
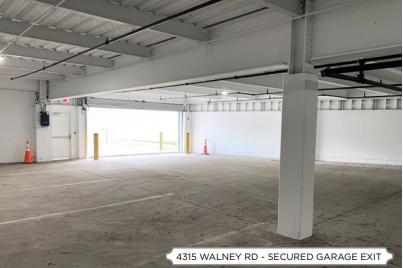
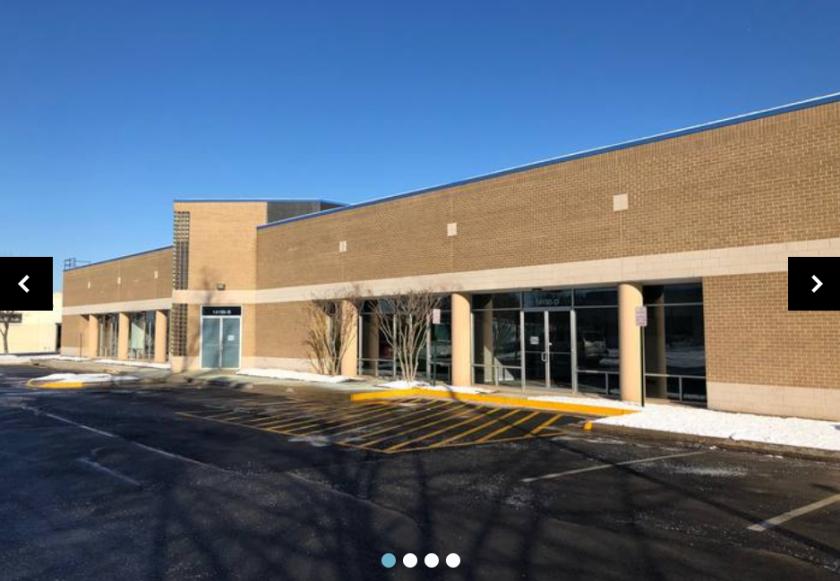
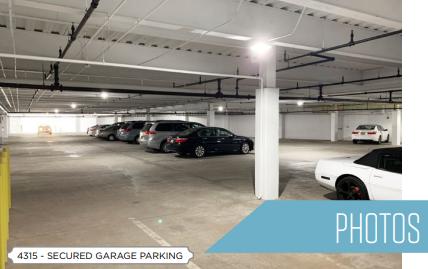
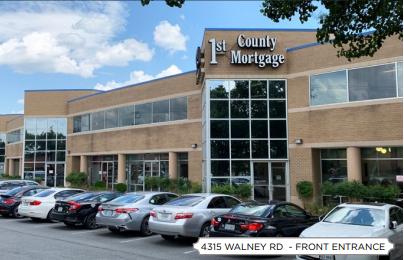
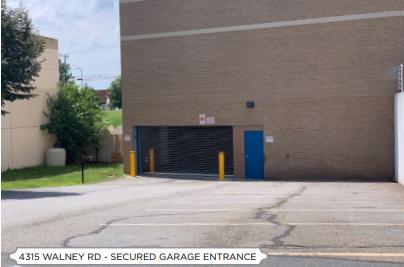
Additional Photos

Listing Agents

Ryan Moody
O: 703-268-2739
M: 301-980-9595
rmoody@klnb.com
O: 703-268-2739
M: 301-980-9595
rmoody@klnb.com

Marc Tasker
O: 703-268-2735
M: 703-932-2073
mtasker@klnb.com
O: 703-268-2735
M: 703-932-2073
mtasker@klnb.com

Keenan Woofter
O: 703-268-2744
M: 301-312-1304
kwoofter@klnb.com
O: 703-268-2744
M: 301-312-1304
kwoofter@klnb.com
While we strive to provide the most accurate information, all listing information, and demographic data, is provided by third-parties. As such, MyEListing will not be responsible for the accuracy of the information. It is strongly recommended that you verify all information with the listing agent, and any relevant agencies, prior to making any decisions.