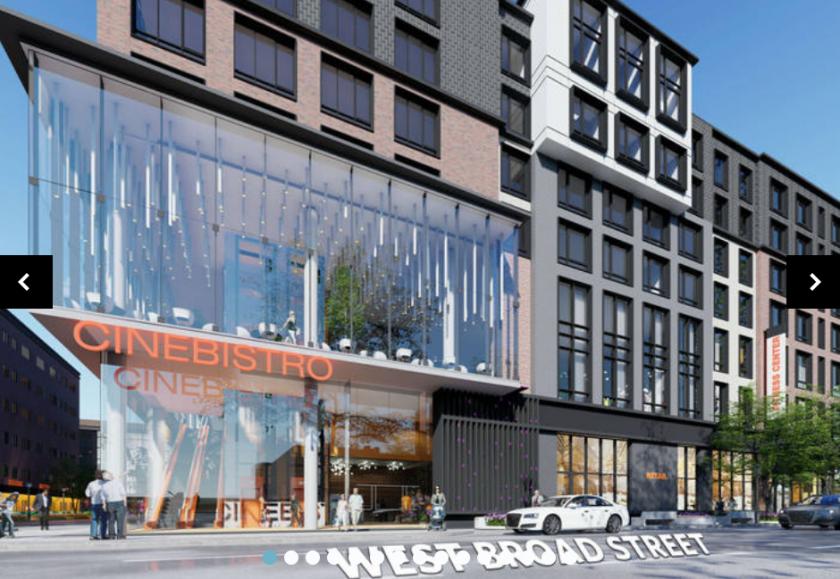
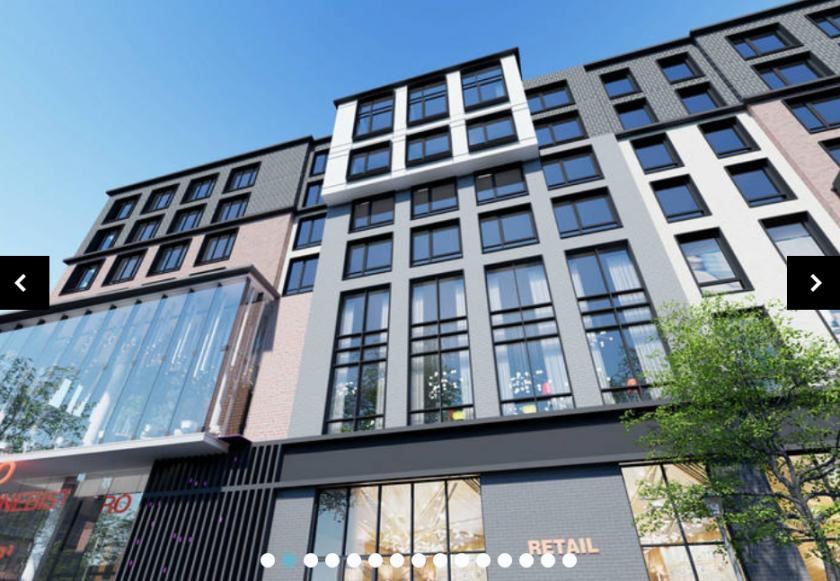
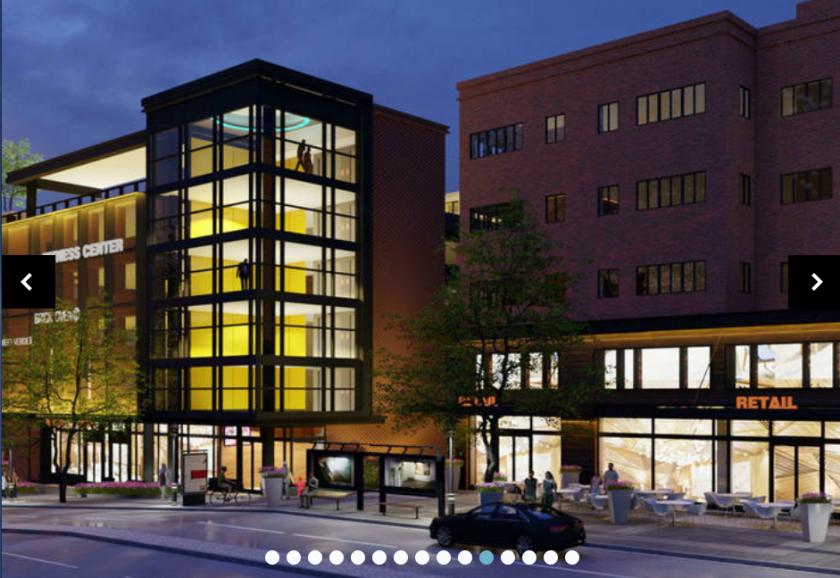
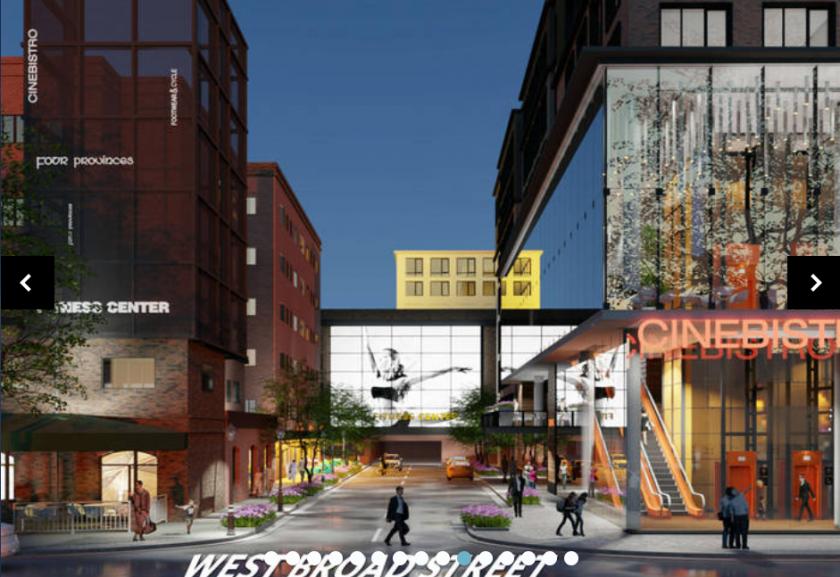
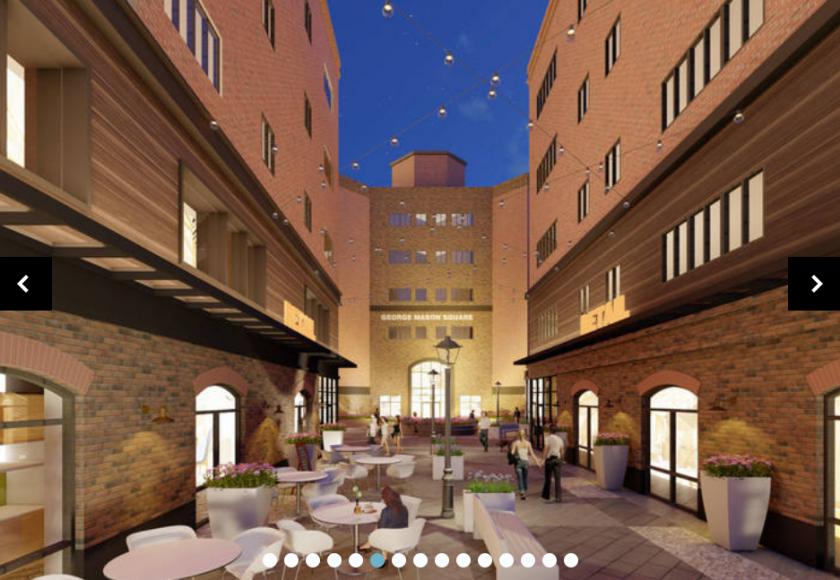
1-Mile | 3-Miles | 5-Miles | ||
---|---|---|---|---|
Total Population | 21,950 | 162,683 | 473,275 | |
Population Median Age | 38 | 38 | 38 | |
Population by Age | 0-9 Yrs | 3005 (13%) | 22665 (13%) | 61022 (12%) |
10-19 Yrs | 2483 (11%) | 18788 (11%) | 50200 (10%) | |
20-29 Yrs | 2733 (12%) | 19935 (12%) | 68773 (14%) | |
30-39 Yrs | 3213 (14%) | 25926 (15%) | 81917 (17%) | |
40-49 Yrs | 3355 (15%) | 24141 (14%) | 66957 (14%) | |
50-59 Yrs | 3020 (13%) | 20906 (12%) | 57998 (12%) | |
60-69 Yrs | 2506 (11%) | 16955 (10%) | 46963 (9%) | |
70+ Yrs | 1636 (7%) | 13368 (8%) | 39446 (8%) | |
Median HH Income | $124,915 | $129,493 | $115,225 | |
Total Household Income | < 24K | 633 (7%) | 4505 (7%) | 16844 (9%) |
25-49K | 765 (9%) | 6012 (10%) | 19916 (10%) | |
50-74K | 782 (9%) | 6002 (10%) | 22011 (12%) | |
75-99K | 871 (10%) | 6166 (10%) | 21315 (11%) | |
100-199K | 2859 (35%) | 18931 (32%) | 57695 (31%) | |
200K+ | 2255 (27%) | 16902 (28%) | 44820 (24%) | |
Highest Education Level | No Diploma | 977 | 10719 | 29537 |
Diploma or GED | 1725 | 12829 | 38289 | |
Some College | 1731 | 11034 | 35829 | |
Assoc. Degree | 717 | 4911 | 14968 | |
Bachelors Degree | 4764 | 34301 | 102730 | |
Higher Degree | 5361 | 39017 | 113216 | |
Total Housing Units | 8,595 | 61,619 | 193,040 | |
--Owner-Occupied | 5,091 | 37,683 | 98,042 | |
--Renter-Occupied | 3,073 | 20,834 | 84,559 | |
Owner-Occupied Values | < 100K | 11 | 206 | 741 |
100-199K | 181 | 1322 | 3958 | |
200-299K | 247 | 1473 | 6474 | |
300-399K | 275 | 1867 | 7533 | |
400-499K | 656 | 3946 | 11503 | |
500K+ | 3721 | 28869 | 67832 | |
Total Working Age Population | 17,351 | 128,198 | 380,679 | |
In Work Force | 13,153 | 93,627 | 280,885 | |
Not In Work Force | 4,198 | 34,571 | 99,793 | |
Workforce Employed | 12,596 | 89,869 | 269,550 | |
Workforce Unemployed | 454 | 3,068 | 9,005 | |
Civlian Workforce | 13,050 | 92,937 | 278,555 | |
Military Workforce | 103 | 689 | 2,331 | |
Total Households | 8,164 | 58,517 | 182,601 | |
Family Households | 5,494 | 40,086 | 109,581 | |
Non-Family Households | 2,670 | 18,431 | 73,021 | |
Married Couple | 4,280 | 32,456 | 86,568 | |
Other Family | 1,215 | 7,630 | 23,013 | |
Married w/Child | 2,151 | 16,311 | 42,116 | |
Single Male w/Child | 122 | 1,067 | 2,634 | |
Single Female w/Child | 565 | 2,415 | 8,056 |
Population Change Last Two Decades - Plus Projection
2000 | % | 2010 | % | 2020 | % | 2030 | |
---|---|---|---|---|---|---|---|
District of Columbia | 572,059 | +5 | 601,723 | +21 | 729,501 | +15 | 842,154 |
Maryland | 5,296,486 | +9 | 5,773,552 | +6 | 6,141,900 | +6 | 6,518,750 |
Montgomery County | 873,341 | +11 | 971,777 | +8 | 1,052,050 | +7 | 1,128,800 |
Prince Georges County | 801,515 | +8 | 863,420 | +6 | 916,150 | +4 | 952,950 |
Virginia | 7,078,515 | +13 | 8,001,024 | +8 | 8,655,021 | +8 | 9,331,666 |
Arlington County | 189,453 | +10 | 207,627 | +20 | 249,298 | +10 | 274,339 |
Fairfax County | 969,749 | +12 | 1,081,726 | +7 | 1,162,504 | +7 | 1,244,025 |
Prince William County | 280,813 | +43 | 402,002 | +19 | 478,134 | +20 | 571,844 |
Alexandria city | 128,283 | +9 | 139,966 | +19 | 166,261 | +10 | 182,067 |
Falls Church city | 10,377 | +19 | 12,332 | +22 | 14,988 | +14 | 17,032 |
Total Working Age Population:
Total Households:
Total Working Age Population:
Total Households:
Total Working Age Population:
Total Households: