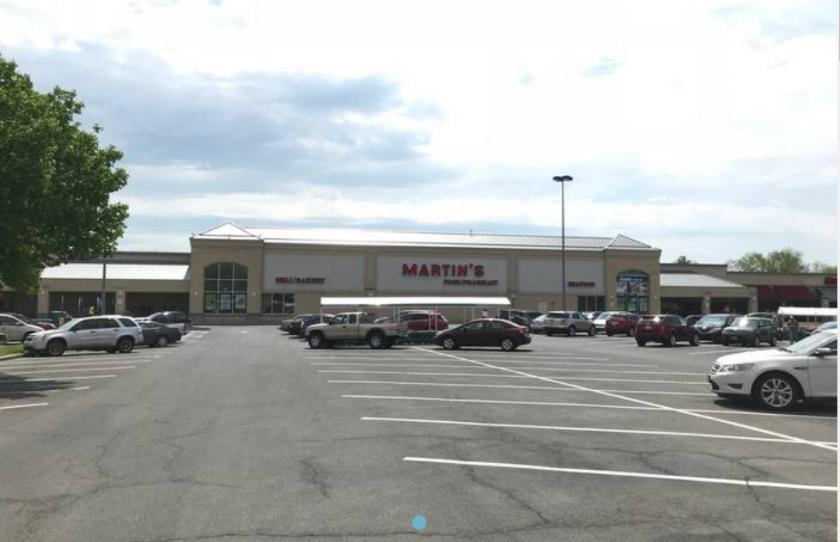
Retail Space
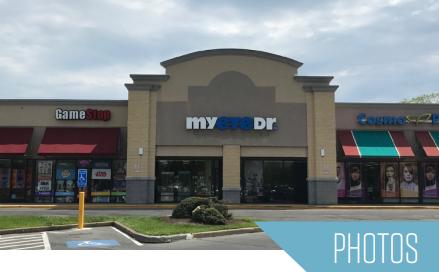
2190 South Pleasant Valley Road Winchester, VA 22601
2190 South Pleasant Valley Road Winchester, VA 22601
Details & Description
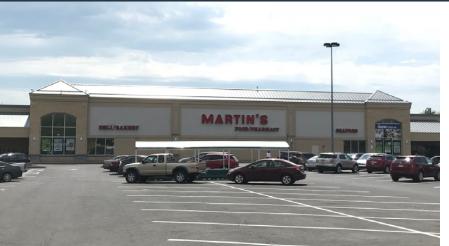
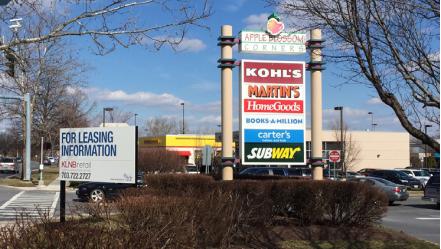
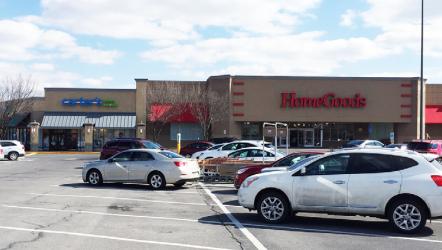
Additional Photos
Listing Agents

Billy Kelly
O: 703-268-2706
M: 703-424-5530
bkelly@klnb.com
O: 703-268-2706
M: 703-424-5530
bkelly@klnb.com

Dallon L. Cheney
O: 703-268-2703
M: 703-850-8342
dcheney@klnb.com
O: 703-268-2703
M: 703-850-8342
dcheney@klnb.com
While we strive to provide the most accurate information, all listing information, and demographic data, is provided by third-parties. As such, MyEListing will not be responsible for the accuracy of the information. It is strongly recommended that you verify all information with the listing agent, and any relevant agencies, prior to making any decisions.


