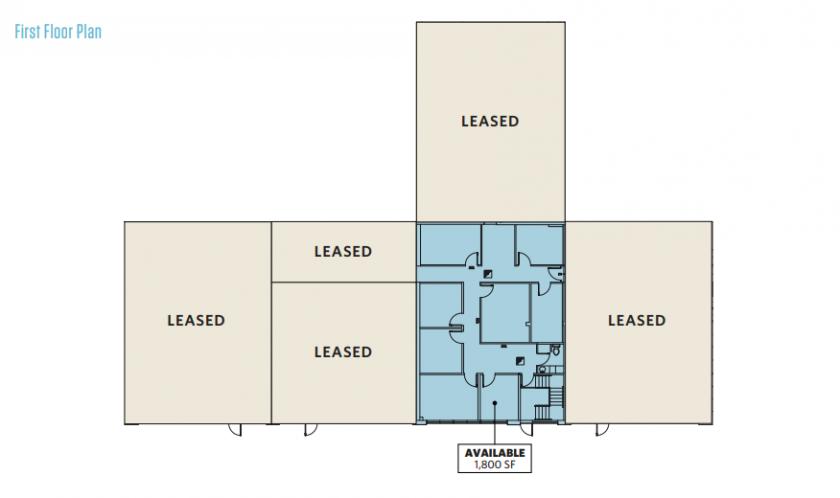
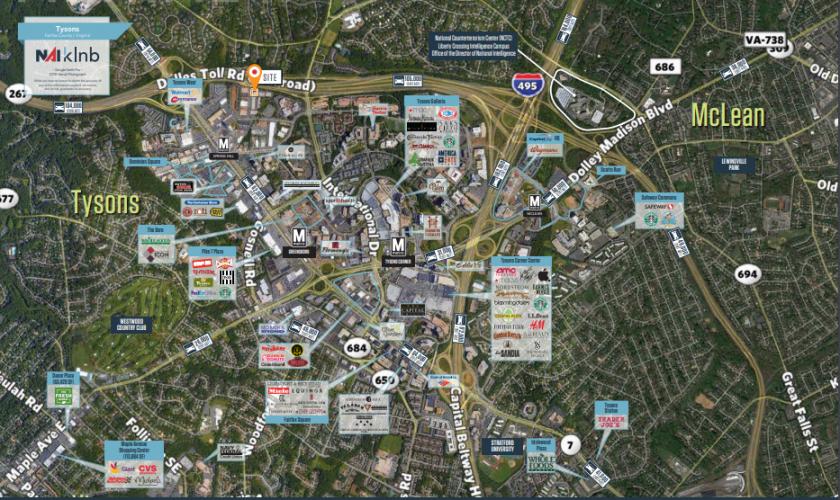
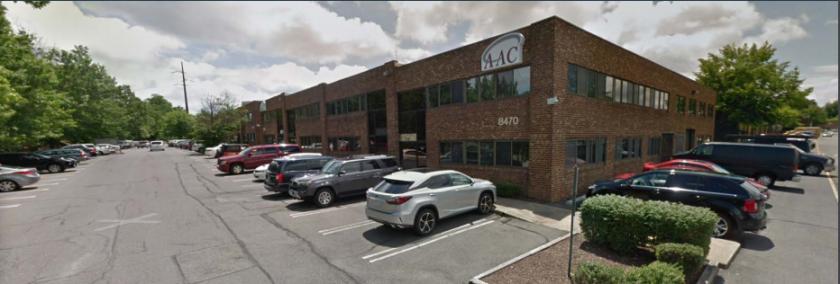
1-Mile | 3-Miles | 5-Miles | ||
---|---|---|---|---|
Total Population | 11,037 | 81,891 | 219,061 | |
Population Median Age | 40 | 39 | 39 | |
Population by Age | 0-9 Yrs | 1140 (10%) | 10354 (12%) | 26938 (12%) |
10-19 Yrs | 1273 (11%) | 10200 (12%) | 27844 (12%) | |
20-29 Yrs | 1701 (15%) | 9834 (12%) | 25945 (11%) | |
30-39 Yrs | 1533 (13%) | 11739 (14%) | 30282 (13%) | |
40-49 Yrs | 1719 (15%) | 11777 (14%) | 31757 (14%) | |
50-59 Yrs | 1208 (10%) | 11249 (13%) | 30409 (13%) | |
60-69 Yrs | 1115 (10%) | 8548 (10%) | 23814 (10%) | |
70+ Yrs | 1346 (12%) | 8189 (9%) | 22073 (10%) | |
Median HH Income | $115,620 | $145,063 | $146,827 | |
Total Household Income | < 24K | 475 (9%) | 2280 (7%) | 5496 (6%) |
25-49K | 349 (7%) | 2049 (6%) | 5604 (6%) | |
50-74K | 604 (12%) | 2830 (9%) | 7334 (9%) | |
75-99K | 711 (14%) | 3624 (11%) | 8506 (10%) | |
100-199K | 1340 (27%) | 8778 (28%) | 25340 (31%) | |
200K+ | 1351 (27%) | 11105 (36%) | 28308 (35%) | |
Highest Education Level | No Diploma | 167 | 2028 | 7089 |
Diploma or GED | 393 | 3881 | 11401 | |
Some College | 695 | 4873 | 14063 | |
Assoc. Degree | 314 | 2307 | 6195 | |
Bachelors Degree | 2559 | 18355 | 49769 | |
Higher Degree | 3670 | 25247 | 63719 | |
Total Housing Units | 5,262 | 32,317 | 85,190 | |
--Owner-Occupied | 2,067 | 19,168 | 53,976 | |
--Renter-Occupied | 2,763 | 11,498 | 26,612 | |
Owner-Occupied Values | < 100K | 11 | 128 | 437 |
100-199K | 27 | 261 | 926 | |
200-299K | 83 | 1001 | 2283 | |
300-399K | 298 | 733 | 2674 | |
400-499K | 212 | 1014 | 4066 | |
500K+ | 1435 | 16031 | 43590 | |
Total Working Age Population | 9,081 | 65,127 | 174,460 | |
In Work Force | 6,268 | 45,367 | 122,343 | |
Not In Work Force | 2,813 | 19,760 | 52,117 | |
Workforce Employed | 5,900 | 43,442 | 117,654 | |
Workforce Unemployed | 337 | 1,650 | 3,800 | |
Civlian Workforce | 6,237 | 45,093 | 121,454 | |
Military Workforce | 31 | 274 | 889 | |
Total Households | 4,830 | 30,666 | 80,588 | |
Family Households | 2,740 | 20,981 | 56,217 | |
Non-Family Households | 2,090 | 9,685 | 24,370 | |
Married Couple | 2,195 | 17,878 | 47,382 | |
Other Family | 546 | 3,104 | 8,836 | |
Married w/Child | 1,153 | 8,815 | 22,396 | |
Single Male w/Child | 60 | 558 | 1,348 | |
Single Female w/Child | 179 | 853 | 2,993 |
Population Change Last Two Decades - Plus Projection
2000 | % | 2010 | % | 2020 | % | 2030 | |
---|---|---|---|---|---|---|---|
Maryland | 5,296,486 | +9 | 5,773,552 | +6 | 6,141,900 | +6 | 6,518,750 |
Montgomery County | 873,341 | +11 | 971,777 | +8 | 1,052,050 | +7 | 1,128,800 |
Virginia | 7,078,515 | +13 | 8,001,024 | +8 | 8,655,021 | +8 | 9,331,666 |
Arlington County | 189,453 | +10 | 207,627 | +20 | 249,298 | +10 | 274,339 |
Fairfax County | 969,749 | +12 | 1,081,726 | +7 | 1,162,504 | +7 | 1,244,025 |
Loudoun County | 169,599 | +84 | 312,311 | +38 | 430,584 | +29 | 554,808 |
Prince William County | 280,813 | +43 | 402,002 | +19 | 478,134 | +20 | 571,844 |
Fairfax city | 21,498 | +5 | 22,565 | +11 | 25,047 | +5 | 26,397 |
Falls Church city | 10,377 | +19 | 12,332 | +22 | 14,988 | +14 | 17,032 |
Total Working Age Population:
Total Households:
Total Working Age Population:
Total Households:
Total Working Age Population:
Total Households: