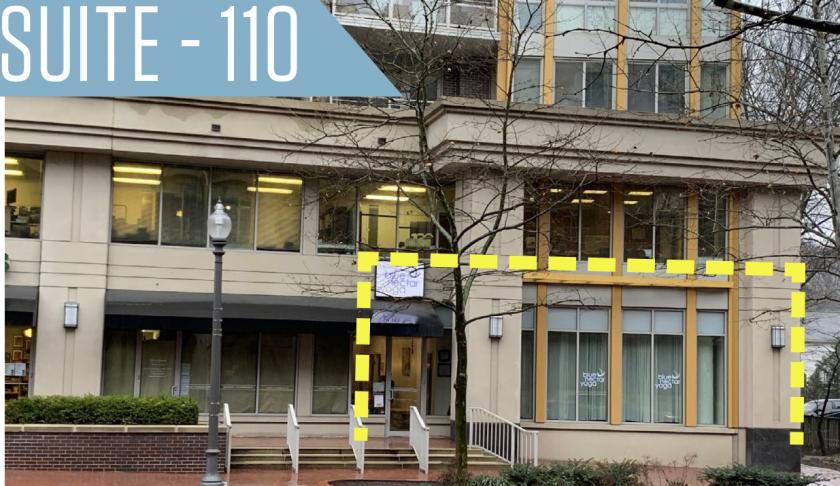
1-Mile | 3-Miles | 5-Miles | ||
---|---|---|---|---|
Total Population | 20,515 | 162,669 | 438,154 | |
Population Median Age | 38 | 38 | 38 | |
Population by Age | 0-9 Yrs | 2891 (14%) | 22428 (13%) | 56445 (12%) |
10-19 Yrs | 2591 (12%) | 18625 (11%) | 47848 (10%) | |
20-29 Yrs | 2305 (11%) | 19600 (12%) | 62670 (14%) | |
30-39 Yrs | 2832 (13%) | 26297 (16%) | 72735 (16%) | |
40-49 Yrs | 3156 (15%) | 24228 (14%) | 61778 (14%) | |
50-59 Yrs | 2881 (14%) | 20987 (12%) | 54540 (12%) | |
60-69 Yrs | 2319 (11%) | 16922 (10%) | 44083 (10%) | |
70+ Yrs | 1539 (7%) | 13582 (8%) | 38056 (8%) | |
Median HH Income | $139,676 | $131,010 | $120,042 | |
Total Household Income | < 24K | 525 (6%) | 4381 (7%) | 15494 (9%) |
25-49K | 601 (7%) | 5875 (9%) | 17251 (10%) | |
50-74K | 645 (8%) | 6042 (10%) | 18801 (11%) | |
75-99K | 788 (10%) | 6324 (10%) | 19033 (11%) | |
100-199K | 2641 (34%) | 19414 (32%) | 53283 (31%) | |
200K+ | 2360 (31%) | 17354 (29%) | 44299 (26%) | |
Highest Education Level | No Diploma | 575 | 9494 | 26518 |
Diploma or GED | 1391 | 12432 | 33457 | |
Some College | 1536 | 10951 | 31171 | |
Assoc. Degree | 614 | 4887 | 13155 | |
Bachelors Degree | 4388 | 35109 | 95827 | |
Higher Degree | 5514 | 40612 | 108256 | |
Total Housing Units | 7,915 | 62,574 | 177,468 | |
--Owner-Occupied | 4,966 | 38,054 | 94,056 | |
--Renter-Occupied | 2,594 | 21,334 | 74,104 | |
Owner-Occupied Values | < 100K | 11 | 221 | 665 |
100-199K | 143 | 1333 | 3452 | |
200-299K | 223 | 1838 | 5710 | |
300-399K | 228 | 1959 | 6544 | |
400-499K | 458 | 3610 | 10316 | |
500K+ | 3903 | 29093 | 67370 | |
Total Working Age Population | 15,966 | 128,330 | 351,430 | |
In Work Force | 12,006 | 93,860 | 256,840 | |
Not In Work Force | 3,959 | 34,470 | 94,590 | |
Workforce Employed | 11,511 | 90,186 | 246,523 | |
Workforce Unemployed | 403 | 3,021 | 8,270 | |
Civlian Workforce | 11,915 | 93,207 | 254,793 | |
Military Workforce | 92 | 653 | 2,047 | |
Total Households | 7,560 | 59,388 | 168,160 | |
Family Households | 5,273 | 40,411 | 102,796 | |
Non-Family Households | 2,288 | 18,977 | 65,365 | |
Married Couple | 4,113 | 32,900 | 82,024 | |
Other Family | 1,160 | 7,511 | 20,772 | |
Married w/Child | 2,139 | 16,570 | 39,830 | |
Single Male w/Child | 124 | 1,057 | 2,494 | |
Single Female w/Child | 597 | 2,378 | 7,352 |
Population Change Last Two Decades - Plus Projection
2000 | % | 2010 | % | 2020 | % | 2030 | |
---|---|---|---|---|---|---|---|
District of Columbia | 572,059 | +5 | 601,723 | +21 | 729,501 | +15 | 842,154 |
Maryland | 5,296,486 | +9 | 5,773,552 | +6 | 6,141,900 | +6 | 6,518,750 |
Montgomery County | 873,341 | +11 | 971,777 | +8 | 1,052,050 | +7 | 1,128,800 |
Prince Georges County | 801,515 | +8 | 863,420 | +6 | 916,150 | +4 | 952,950 |
Virginia | 7,078,515 | +13 | 8,001,024 | +8 | 8,655,021 | +8 | 9,331,666 |
Arlington County | 189,453 | +10 | 207,627 | +20 | 249,298 | +10 | 274,339 |
Fairfax County | 969,749 | +12 | 1,081,726 | +7 | 1,162,504 | +7 | 1,244,025 |
Prince William County | 280,813 | +43 | 402,002 | +19 | 478,134 | +20 | 571,844 |
Alexandria city | 128,283 | +9 | 139,966 | +19 | 166,261 | +10 | 182,067 |
Fairfax city | 21,498 | +5 | 22,565 | +11 | 25,047 | +5 | 26,397 |
Falls Church city | 10,377 | +19 | 12,332 | +22 | 14,988 | +14 | 17,032 |
Total Working Age Population:
Total Households:
Total Working Age Population:
Total Households:
Total Working Age Population:
Total Households: