Industrial Properties
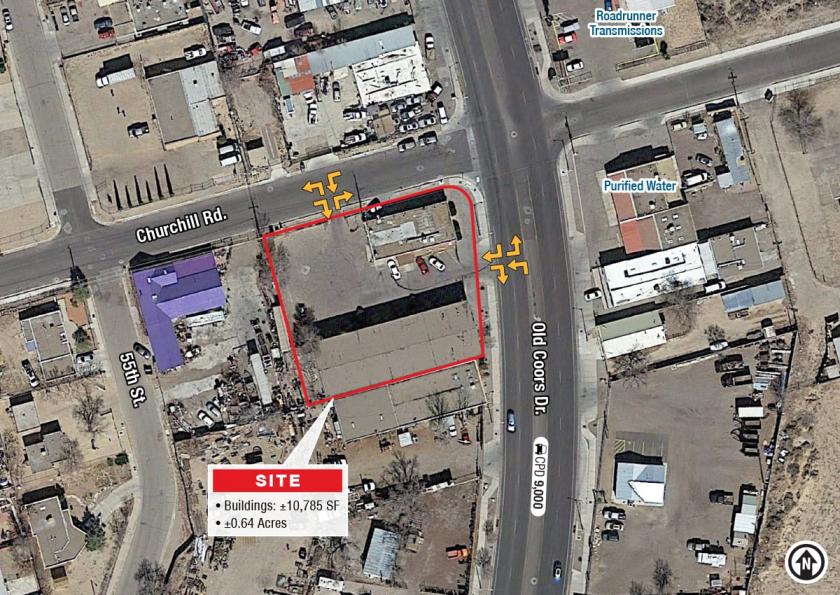
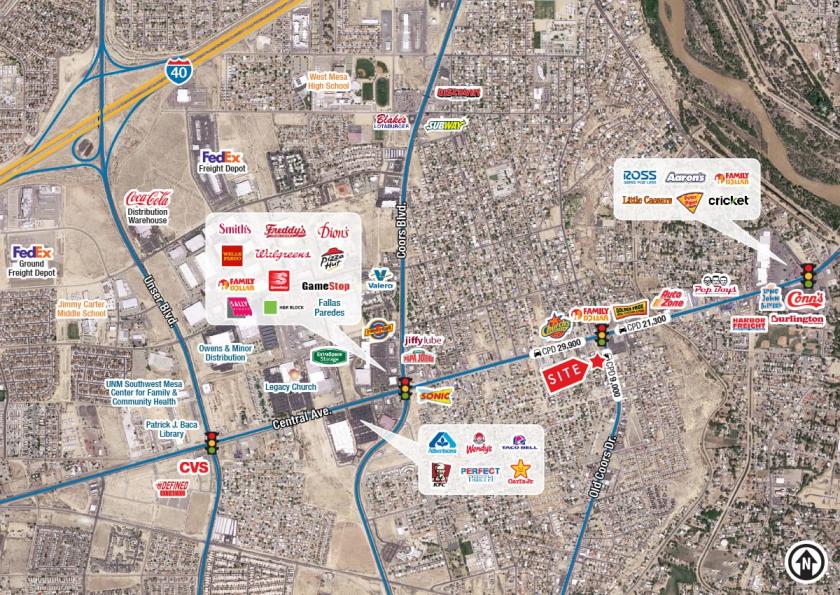
301 Old Coors Drive Southwest Albuquerque, NM 87121
301 Old Coors Drive Southwest Albuquerque, NM 87121
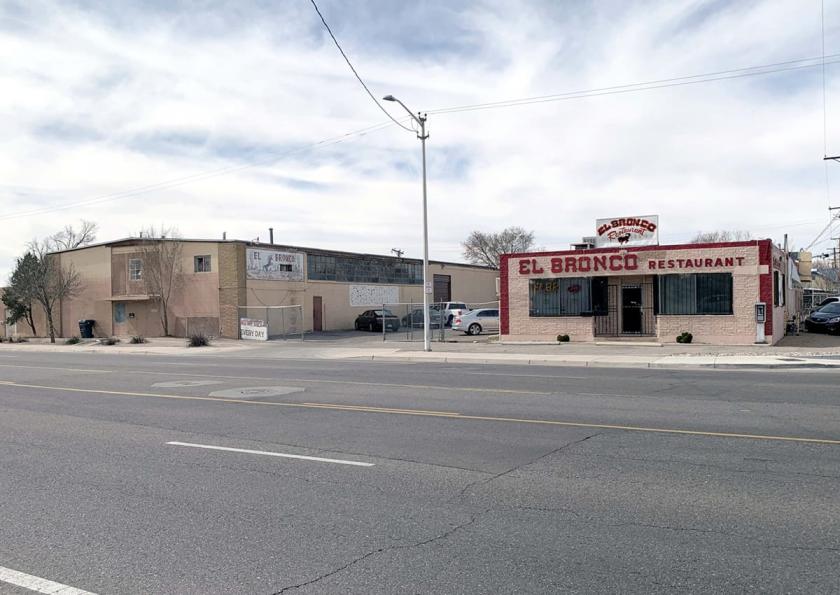
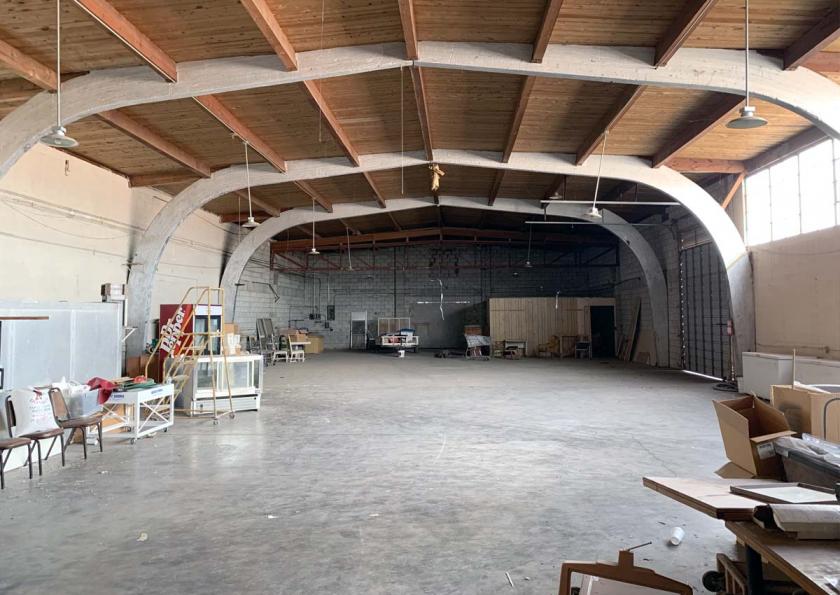
Details & Description
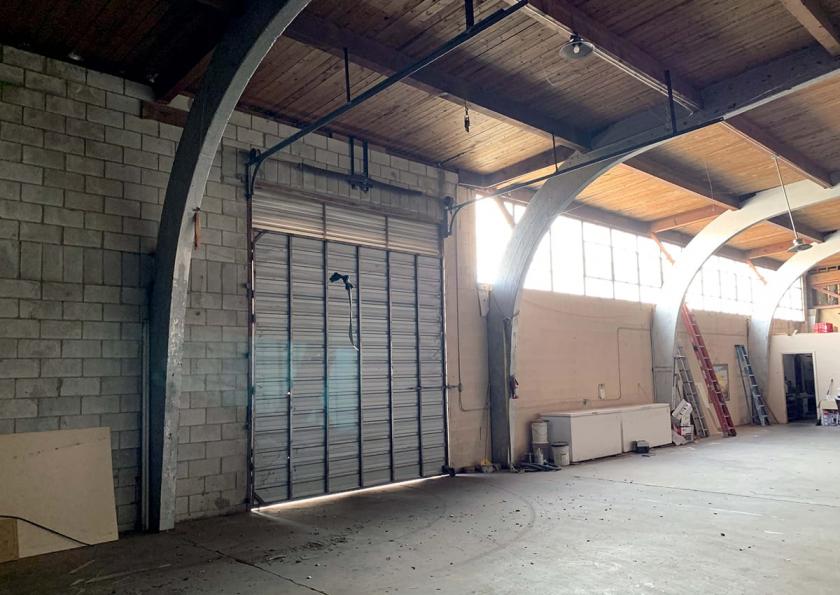
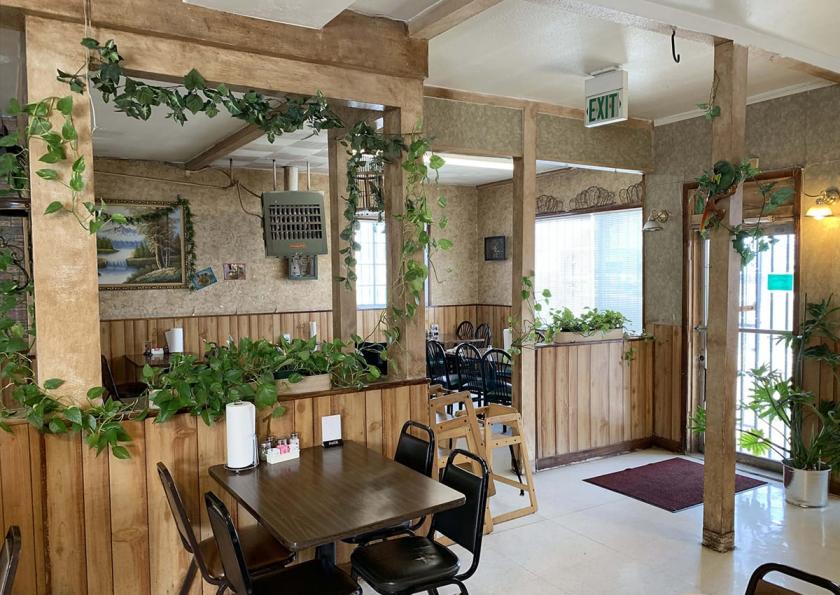
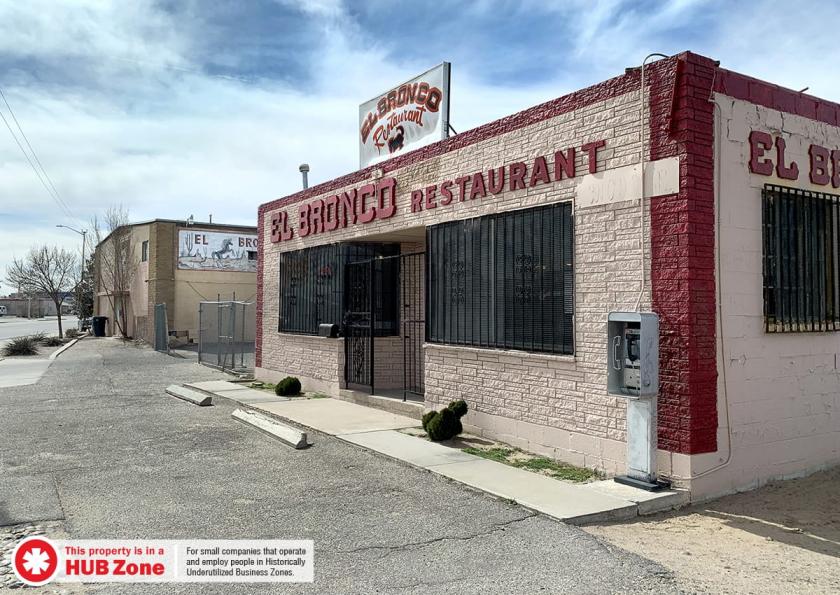
Additional Photos
Listing Agents

Jim Hakeem
O: 505-878-0006
M: 505-250-8542
jim@sunvista.com
O: 505-878-0006
M: 505-250-8542
jim@sunvista.com

John Algermissen
O: 505-998-5734
M: 505-264-7242
johna@sunvista.com
O: 505-998-5734
M: 505-264-7242
johna@sunvista.com
While we strive to provide the most accurate information, all listing information, and demographic data, is provided by third-parties. As such, MyEListing will not be responsible for the accuracy of the information. It is strongly recommended that you verify all information with the listing agent, and any relevant agencies, prior to making any decisions.