Multifamily Housing
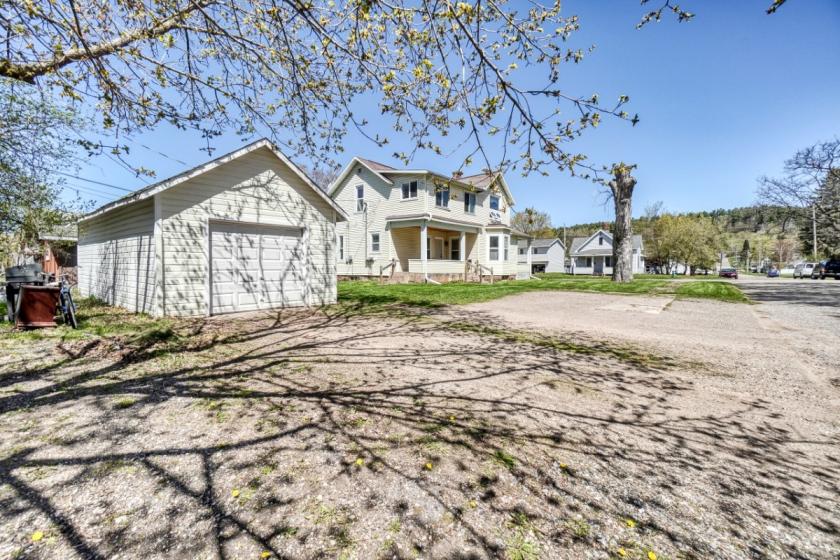
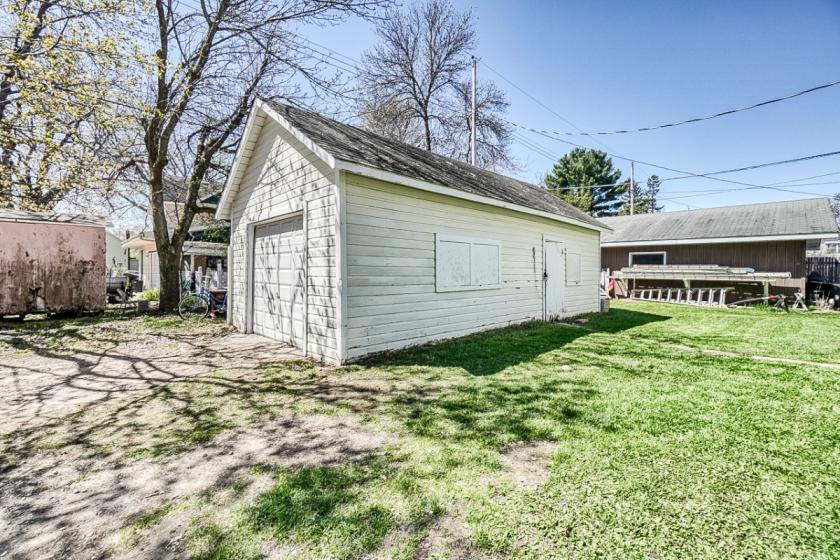
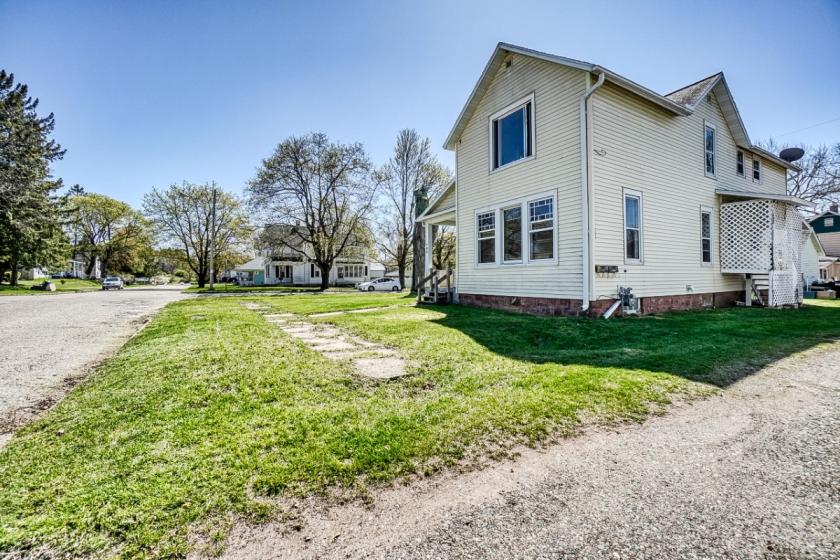
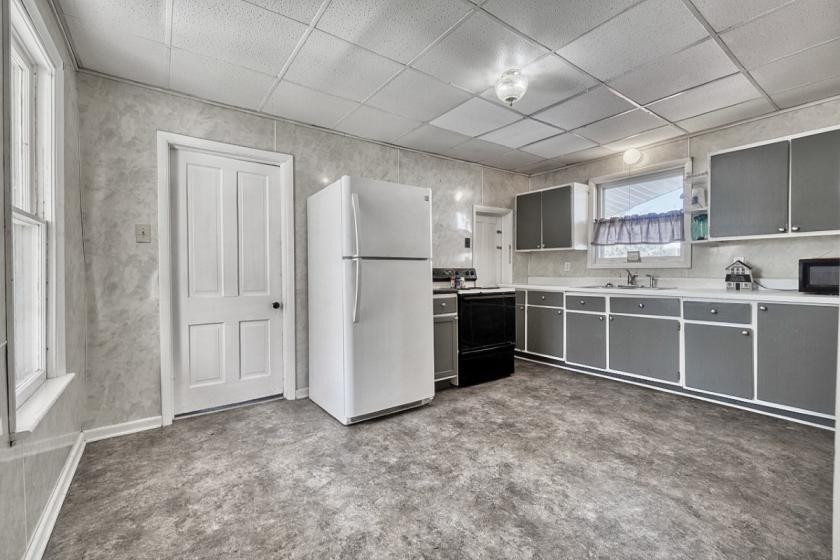
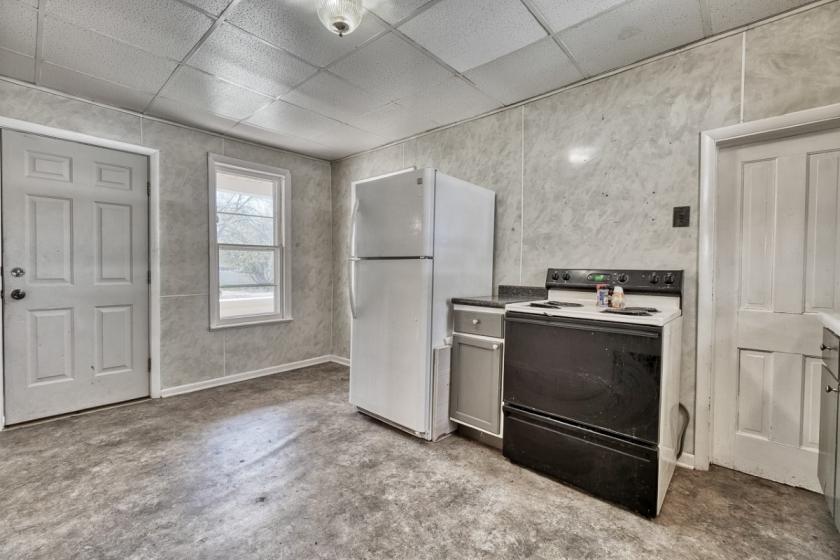
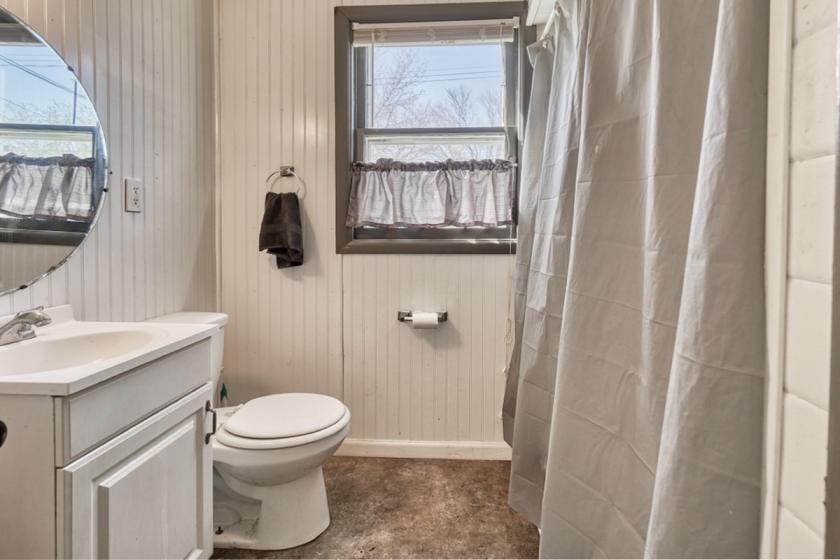
703 Wells Street Iron Mountain, MI 49801
703 Wells Street Iron Mountain, MI 49801

Details & Description
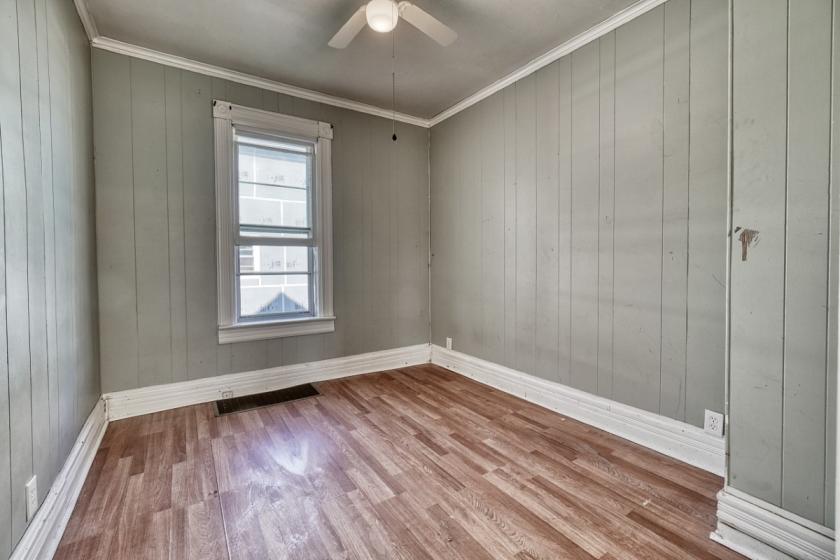
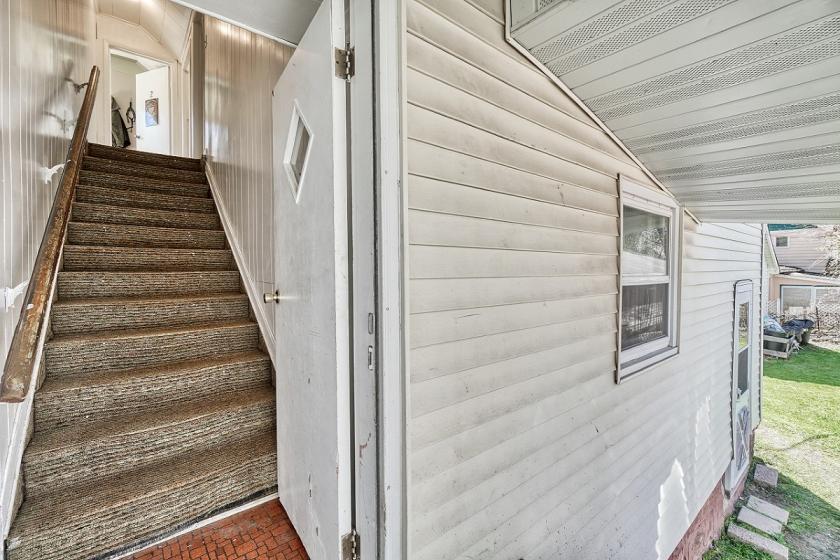
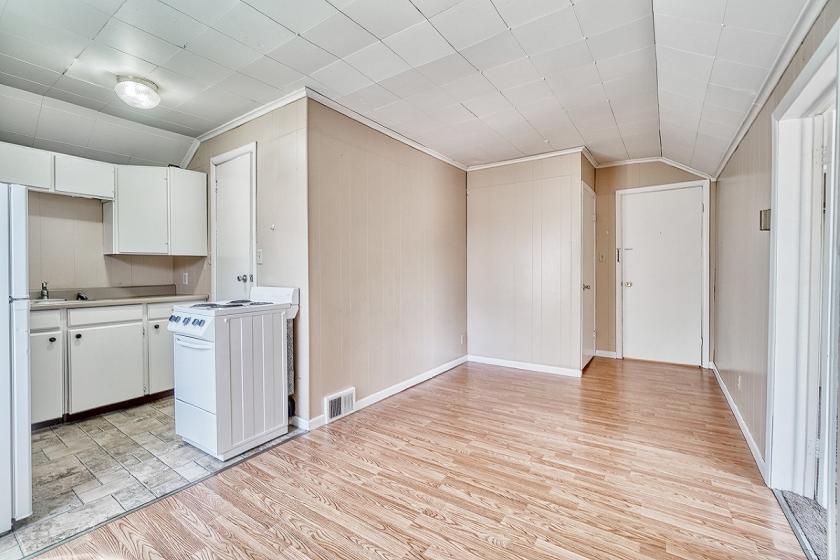
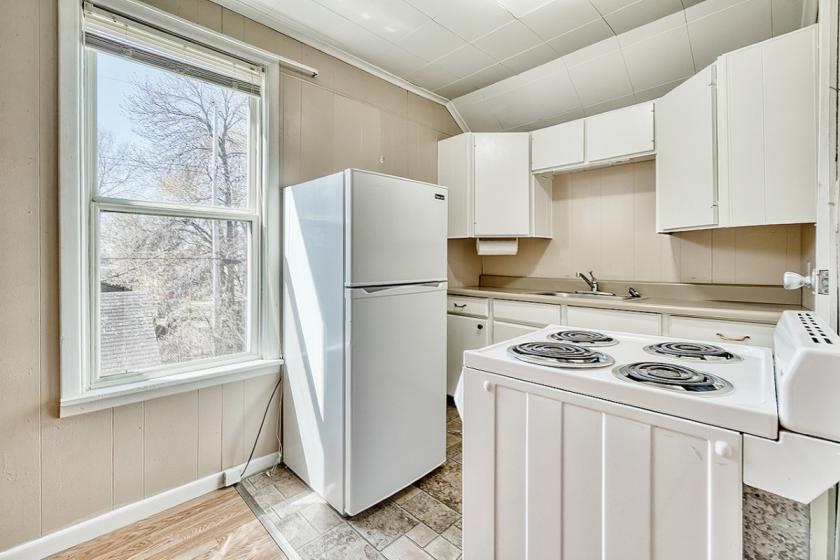
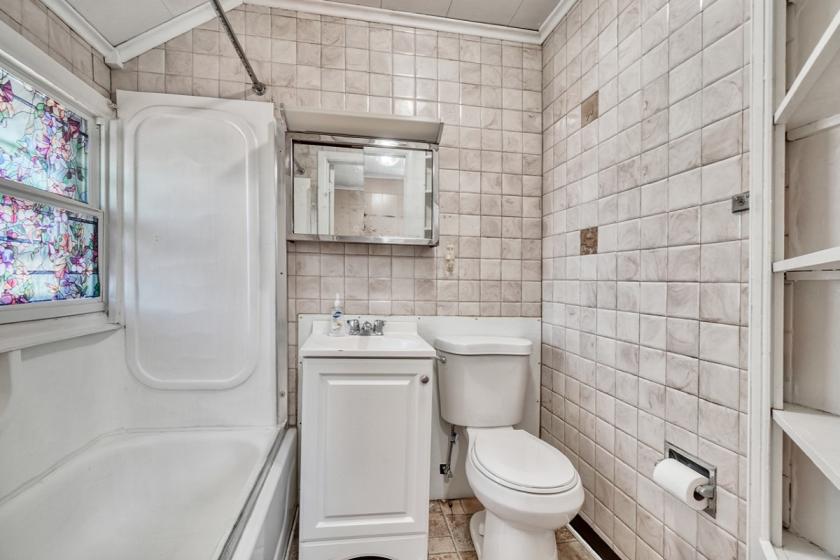
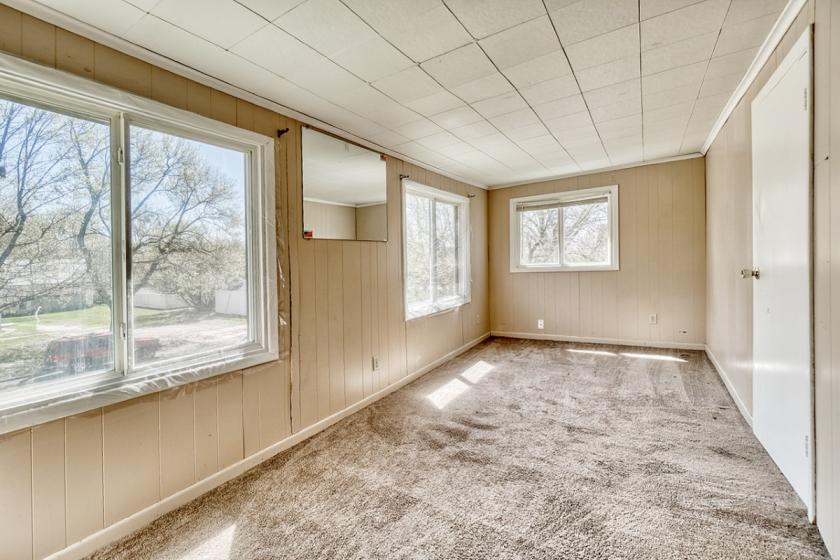
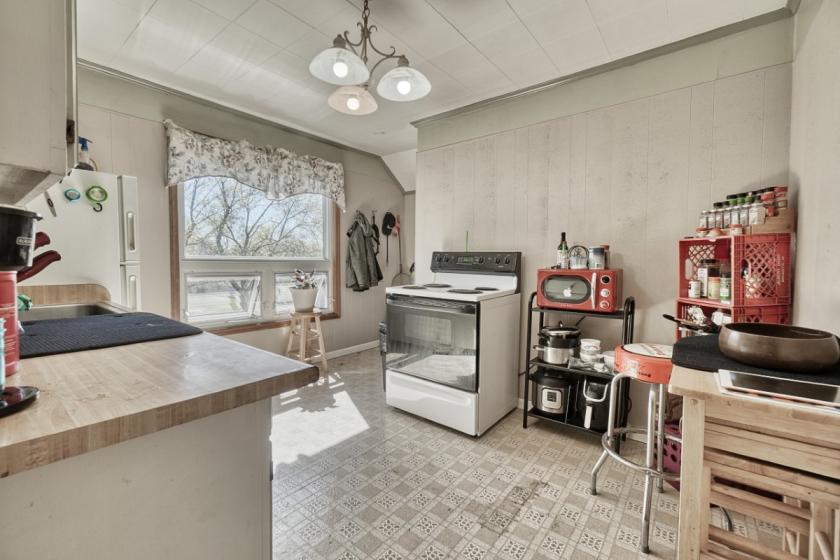
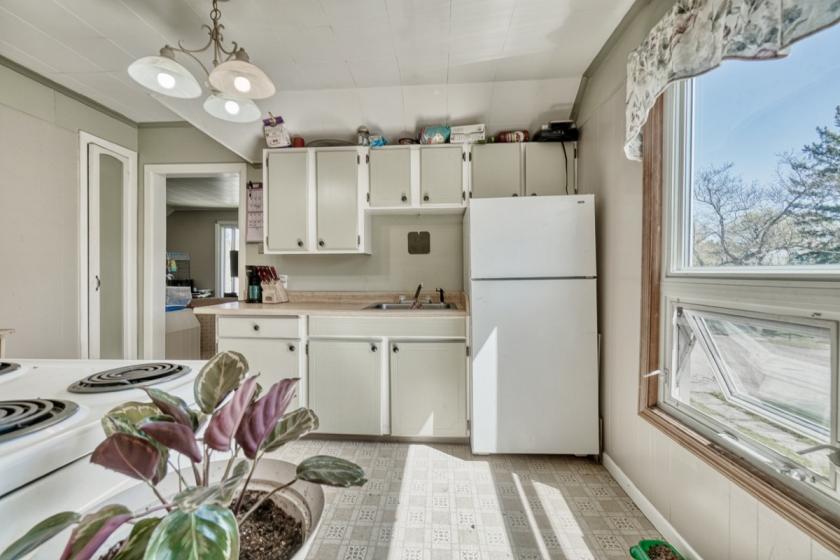
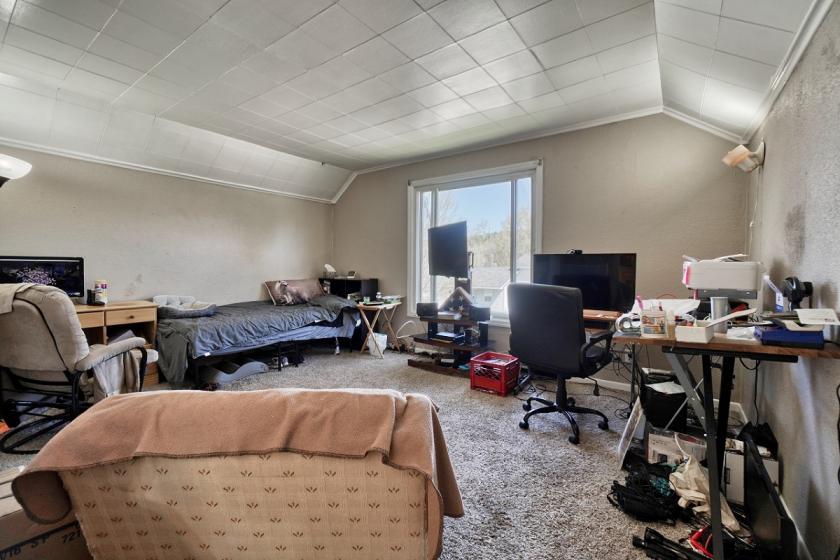
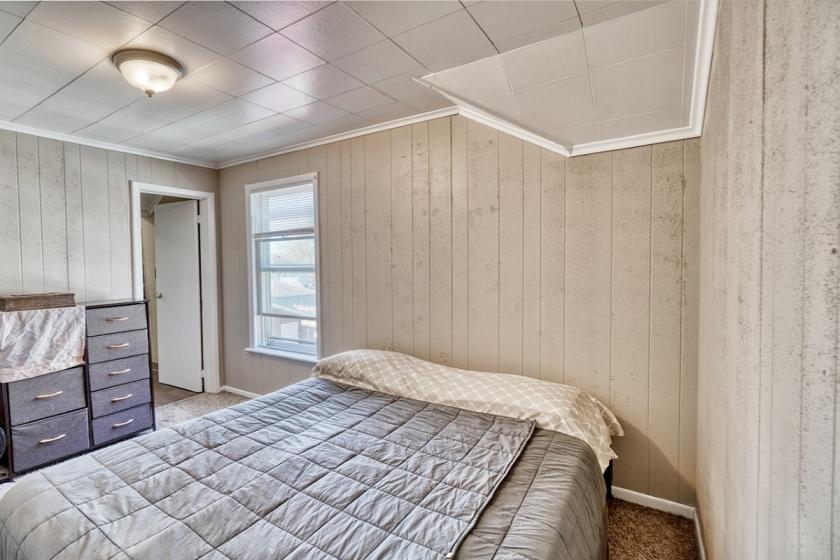
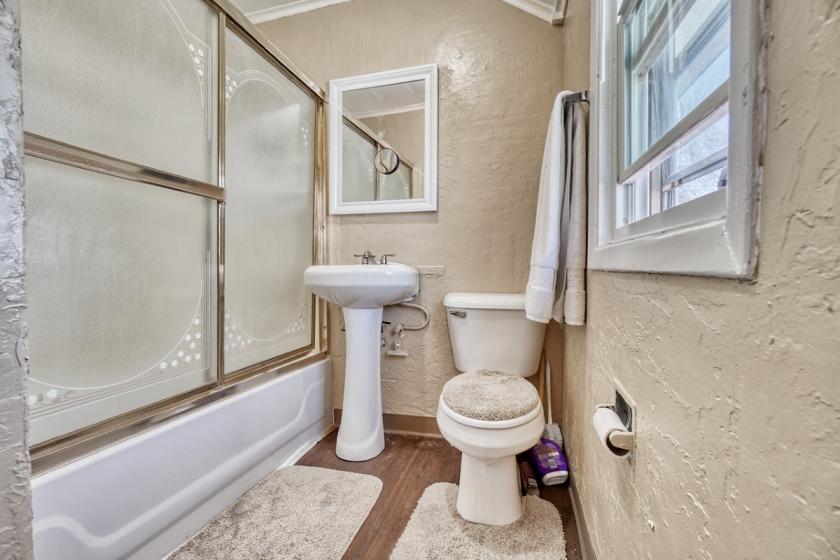
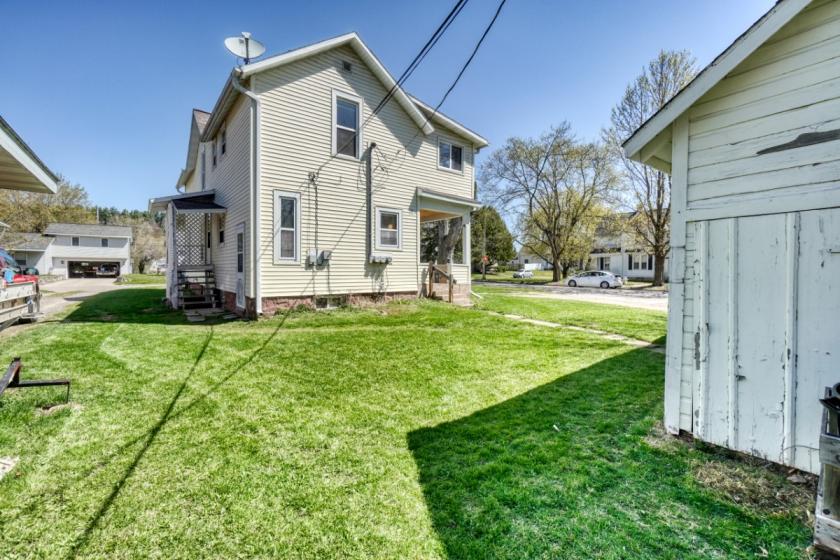
Additional Photos

Listing Agents

Ryan Gordon
O: 906-774-8570
M: 906-282-1644
info@stephensandassoc.com
O: 906-774-8570
M: 906-282-1644
info@stephensandassoc.com
While we strive to provide the most accurate information, all listing information, and demographic data, is provided by third-parties. As such, MyEListing will not be responsible for the accuracy of the information. It is strongly recommended that you verify all information with the listing agent, and any relevant agencies, prior to making any decisions.