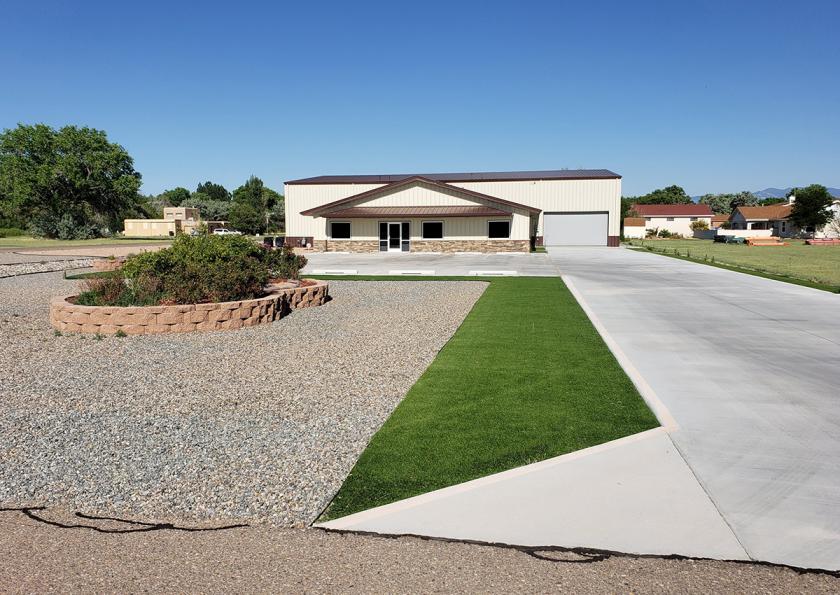
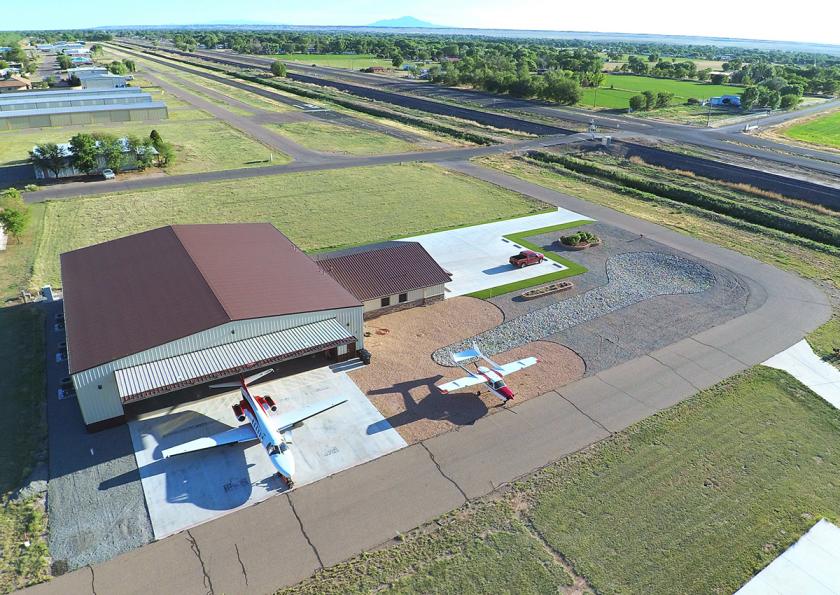
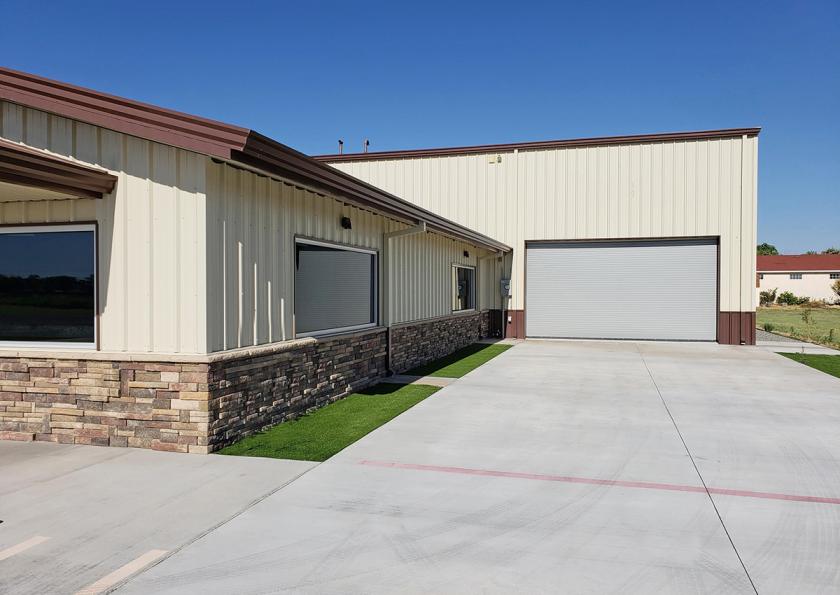
Office Space
313 Hathaway Circle Los Lunas, NM 87031
313 Hathaway Circle Los Lunas, NM 87031
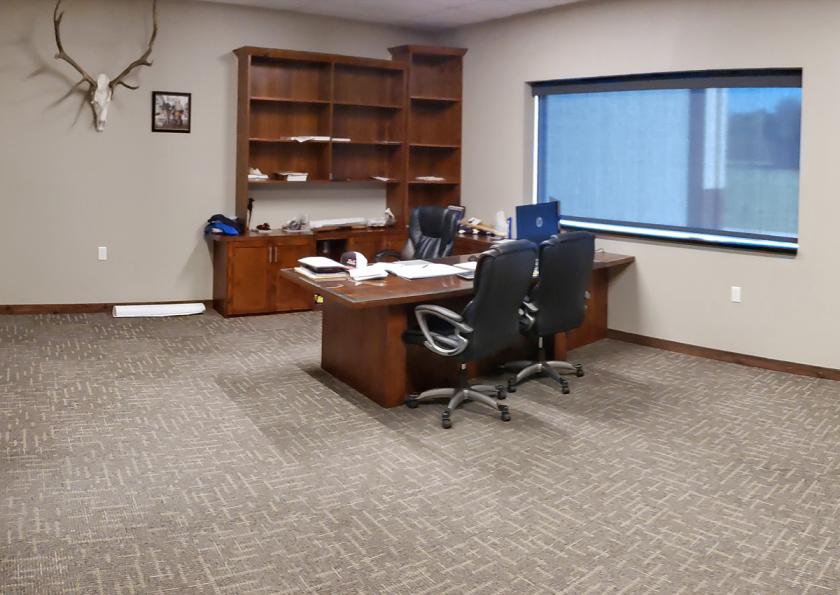
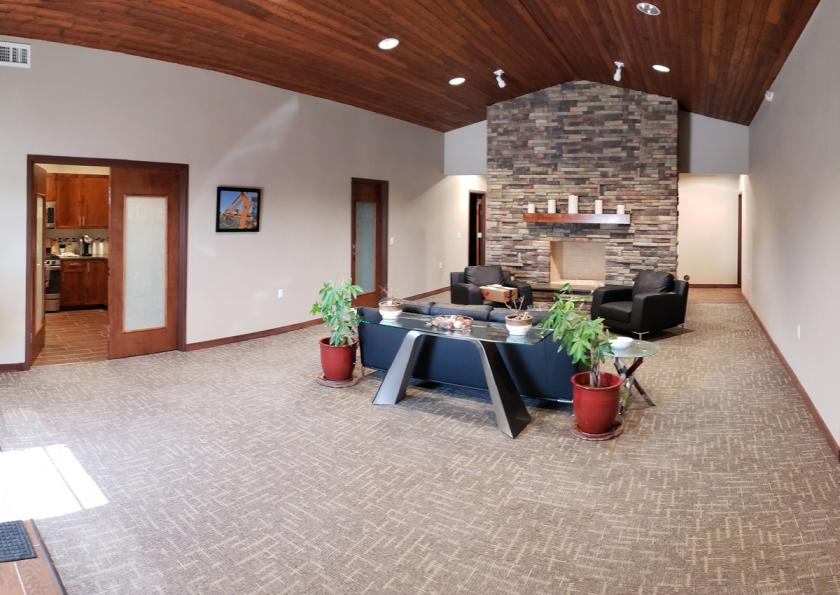
Details & Description
Additional Photos

Listing Agents

DJ Brigman
O: 505-998-1562
M: 505-238-7941
dj@sunvista.com
O: 505-998-1562
M: 505-238-7941
dj@sunvista.com

Dave Hill
O: 505-998-1576
M: 505-238-6413
dave@sunvista.com
O: 505-998-1576
M: 505-238-6413
dave@sunvista.com
While we strive to provide the most accurate information, all listing information, and demographic data, is provided by third-parties. As such, MyEListing will not be responsible for the accuracy of the information. It is strongly recommended that you verify all information with the listing agent, and any relevant agencies, prior to making any decisions.