2,165 SF of prominent retail space + 2,995 SF Lower Level available
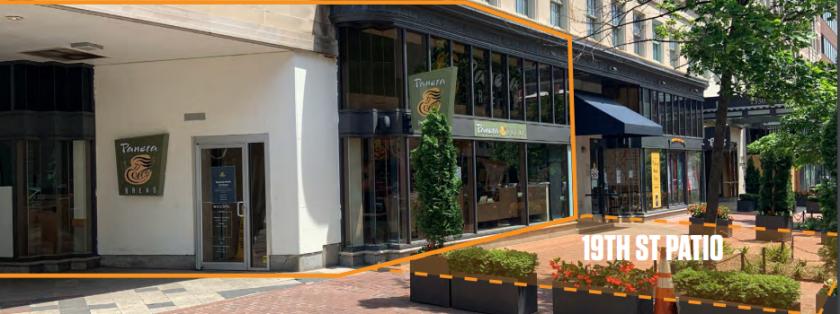
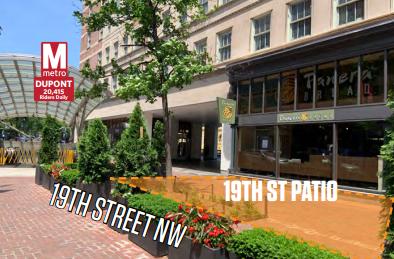
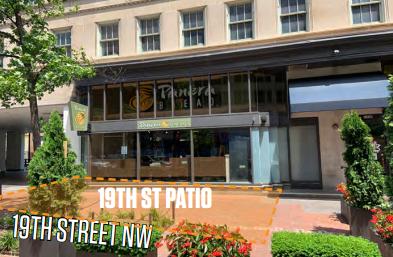
Large Outdoor Patio Available
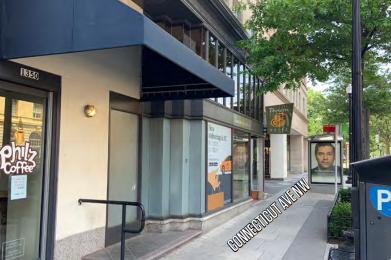
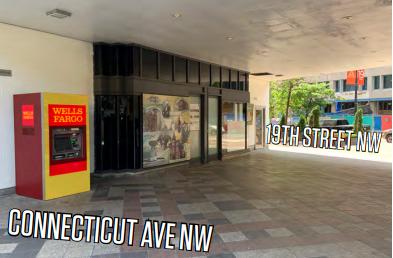
Space has frontage on both Connecticut Avenue and 19th Street, NW
Directly atop DuPont Circle Metro Escalators (20,415 RDP)
Prime visibility to Connecticut Avenue’s 27,200 cars per day
Strong seven day foot traffic
Fantastic demographics with dense daytime and residential populations
No part of this information may be copied, reproduced, repurposed, or screen-captured for any commercial purpose without prior written authorization from MyEListing.
While we strive to provide the most accurate information, all listing information, and demographic data, is provided by third-parties. As such, MyEListing will not be responsible for the accuracy of the information. It is strongly recommended that you verify all information with the listing agent, and any relevant agencies, prior to making any decisions.
What is the building size of this commercial Retail property?
The size of this lease property at '.1350 Connecticut Avenue Northwest.' is 2165 square feet
What kind of Retail is the propery at 1350 Connecticut Avenue Northwest?
The property at 1350 Connecticut Avenue Northwest Washington, DC 20036 is listed as a Shopping Center Retail property
What is the population within 1 mile of 1350 Connecticut Avenue Northwest in Washington?
The population within 1 mile of 1350 Connecticut Avenue Northwest Washington, DC 20036 is 75,070 people.
Who do I contact for questions about 1350 Connecticut Avenue Northwest?
You should contact the listing agent,
Matt Skalet, for any details regarding this commercial listing.